Ransomware analysis with Volatility
In this article, we’ll discuss the Volatility framework and how to perform analysis on ransomware using it. We’ll discuss various capabilities of the tool that can allow us to perform forensic analysis.
For this article, we’ll be analyzing two notorious forms of malware, WannaCry and Jigsaw. The malware handled in this article will be within a sandboxed environment.

Become a certified reverse engineer!
A brief overview of the Volatility framework
The Volatility framework is an open-source memory forensics tool that is maintained by the Volatility Foundation. The Volatility Foundation is an NGO that also conducts workshops and contests to educate participants on cutting-edge research on memory analysis.
Volatility allows memory analysts to extract memory artifacts from RAM (memory). This is done regardless of the platform on which the tool is run; in fact, support is offered for the major Operating Systems.
The source code can be found here. However, if you are on Kali Linux, it is installed by default. On Debian-based systems, simply install it using the following command:
sudo apt-get install volatility
The main advantages of Volatility over other memory analysis tools include:
- It is written in Python: A lot of memory analysts are comfortable with Python scripting. This makes them have an easier time working with Volatility than they would with something like windbg, which requires you to learn its scripting syntax
- It is cross-platform: Volatility can run on any platform that supports Python, meaning that you don’t have to waste time downloading or installing .NET libraries or DLLs for support
- It is open-source: Being open-source allows more and more analysts to contribute to the development of Volatility. It also means you don’t have to pay for a tool that will give you basically the same or more of what a paid tool would offer
- It is extensively scriptable: You can be able to automate tasks with Volatility, since it is easily scriptable. For example, you can automatically explore kernel memory using scripts that you write
- It supports many file formats: Volatility has the ability to analyze raw dumps, crash dumps, hibernation files, VMware .vmem, VMware saved state and suspended files, Virtual Box core dumps and much more
You can access a catalog of documented tutorials here in case you are interested in going beyond the scope of this article.
Dumping the ransomware from memory
We installed Windows 7 on VirtualBox and downloaded the Jigsaw ransomware from here. We then executed the ransomware within our Windows 7 install and dumped the memory after the ransomware had run. The command we used to dump the memory into a memory.dmp file is shown below:
We could have worked with the .dump file but wanted to create a .raw file just in case we needed to work with more tools. The command we used to do this is as shown below:
Before we can begin working with Volatility, we need to identify some information on the jigsaw.raw file. For instance, we’re particularly interested in the profile, which according to our Windows 7 install is Win7SP1x64. See more information below:
The pslist plugin allows us to view the process list at the time of memory capture. This can be seen below:
We need to understand the functionality of the process, and we do this by determining the .dll files in use. This can be done using the dlllist plugin and issuing the process ID. See below:
Now, after the initial assessment of the Jigsaw ransomware, we can dump the process .exe file and perform further analysis by reverse-engineering the file and performing other tests on it.
How to perform reconnaissance on ransomware
In this section, we’ll analyze the WannaCry ransomware. The setup here includes a Windows XP SP2 machine on VirtualBox. Let’s now perform some recon on the malware.
Like we did above, we dump the memory of the infected system and start by viewing the image information:
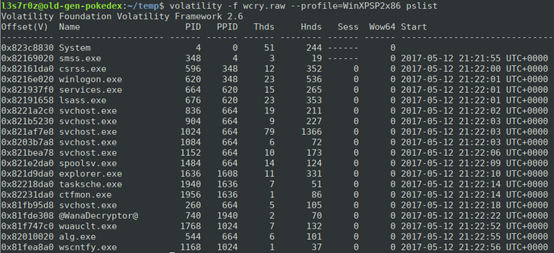
The next thing we do is identify rogue processes at the time of the memory dump. This can be done using pslist, as shown below:
As can be seen above, there are two very suspicious processes that are not normally part of Windows. (Identification can simply be done by Googling the processes and determining suspicious ones). These are tasksche.exe and @WannaDecryptor@. For us to be able to identify the process hierarchy, we use psscan to identify the tasks which were started by tasksche.exe (PID 1940):
Notice that above, the PPID for the five processes is 1940, indicating they were started by tasksche.exe. We need to now determine the folder path which the process executed from, as well as the dlls used. To do this, we use the dlllist plugin. See below:
Doing the same thing for the other suspicious process, @WannaDecryptor@ (PID 740), shows its execution path and the dlls used as well. See below:
The loaded dll files above tell us what the suspicious files are capable of doing. For instance, the process @WannaDecryptor@ is capable of the following:
- Socket creation using the dll file Ws2_32.dll.
- Network communication using the dll file WININET.DLL.
- Registry queries using the dll file ADVAPI32.DLL.
- Encryption using the dll file SECURE32.DLL.
- Browser interaction using the dll file URLMON.DLL.
At this point, what would be interesting to do is to examine the file handles for any more leads. We do that next.
Examining file handles
Volatility allows analysts to display handles in a process. This can be done on all securable executive objects such as events, named pipes, registry keys and mutexes. When viewing the handles, you will be able to see the access and its type.
The WannaCry malware sample above implements a mutex. The purpose of this mutex is to prevent more than one instance of the malware from running. The authors of WannaCry used an old trick that creates a mutex by the name “MsWinZonesCacheCounterMutexA.” We can see this using the command, as shown below:
We also can also view process handle types for both suspicious processes and determine keys that might indicate that the registry has been tampered with. The following key information can be viewed:
We can then extract the key values that are used to perform persistence by using the printkey plugin. We search through the Run, Runonce, WinlogonKeys, BootExecuteKey, Startup folders and Services key. In this case, the Run key is as shown below:
The screenshot above shows that once the system is started, the file tasksche.exe is run, to maintain persistence. We can view more information on the process such as the registry key created, the network ports in use, the threads started and more.
Detecting and dumping hidden DLL
Sometimes, while viewing the handles within a process, you might spot some DLL files that will not be visible with the dlllist plugin. For instance, kernel32.dll is always loaded with every process, but as can be seen below, there are zero handles to it.
In such situations where you might be looking for specific hidden dlls, you might want to resort to using API hooks. Basically, the apihooks plugin will allow you to determine the hooked functions and dump the disassembled code. You will need to browse through this code to identify the location of the hidden dll file you are looking for.
Dumping the identified hidden dll is as simple as using the dlldump plugin.
Conclusion
The Volatility framework is an important set of tools for a security analyst. The cues found within malware, such as certain strings and registry locations, can be used to build indicators of compromise.
This article has served as a basic walkthrough of the capabilities of Volatility. However, it should be noted that there is much more that can be done than what is mentioned here.

Become a certified reverse engineer!
Sources
- Volatility Foundation, GitHub
- Memory Analysis of WannaCry Ransomware, null0x4d5a
- Volatility, my own cheatsheet (Part 2): Processes and DLLs, So Long, and Thanks for All the Fish
- HowTo: Extract "Hidden" API-Hooking BHO DLLs, Volatility Labs
- WannaCry Analysis and Cracking, Medium
- Jigsaw Ransomware Analysis using Volatility, Medium
- Create a .raw memory dump with Volatility, Medium
- Finding Advanced Malware Using Volatility, eForensics Magazine


