Malware instrumentation with Frida
Malware instrumentation is a technique also known as Dynamic Binary Instrumentation (DBI) that allows injecting and executing code within a target process to examine it.
There is a technique used within the malware reverse landscape used to inspect and analyze the behavior of a process during its execution — the dynamic analysis. This phase comprises several steps from the registry analysis until the network traffic analysis. A complementary approach called DBI can be also used to interrogate a target process, inject target scripts, trace API calls, and essentially inspect its internals. Some popular DBI frameworks, including Intel's Pin, DynamoRIO and Frida. Frida is multi-architecture, well documented and can be executed over desktop and mobile operating systems such as Windows, Linux, macOS, iOS, Android and QNX.
With Frida, a custom JavaScript code can be injected into target processes to monitor, intercept and modify function calls' input and return values during its execution. Many tools use Frida as part of their features, such as Runtime Mobile Security framework. However, Frida provides a potent command-line tool that can be used to immediately access its benefits.

Learn Container Security
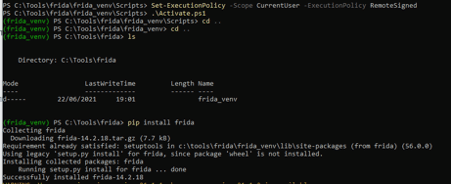
To use Frida-tools on a Windows machine, we need to install Python3 and the Frida itself as presented below and in this article.
PS Set-ExecutionPolicy -Scope CurrentUser -ExecutionPolicy RemoteSignedpython -m venv .
PS C:\Tools\frida\frida_venv\Scripts> .\Activate.ps1
pip install frida
pip install objection
pip install frida-tools
Figure 1: Frida installation process (source).
Taking advantage of Frida's capabilities
Frida-trace
Frida-trace is a tool distributed with Frida with clear advantages for malware analysis. Using this tool, tracing API calls is possible, and the malware engineer can customize the behavior of a specific function.
Some of the possible ways of executing are the following as described here:
frida-trace.exe -f malware.exe -i *CreateFile*frida-trace.exe -f malware.exe -i KERNEL32.DLL!CreateFileA
frida-trace.exe -f malware.exe -i KERNEL32.DLL!OpenMutex*
log('File or device: ' + args[0].readAnsiString());
log('OpenMutexW: ' + args[2].readUtf16String());
A target API call ("*CreateFile*") can be analyzed or even tried to observe if it is called during the malware execution. After running the execution, some JavaScript files are created into the __handlers__ folder, and each function's input and return value can be modified.
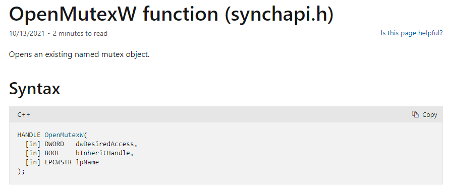
For example, by intercepting the "OpenMutex()" Windows call, we can analyze the name of the opened mutex if the malware executes that function during run-time. According to Microsoft, the "lpName" parameter (position 2) has the name of the mutex to be opened.
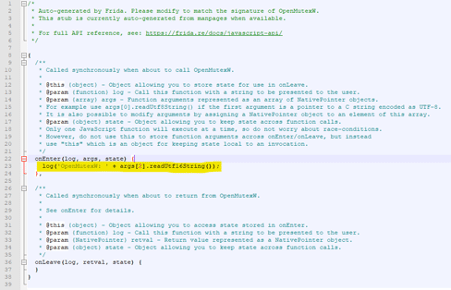
The following line can be added to the JavaScript file as presented below.
log('OpenMutexW: ' + args[2].readUtf16String());Figure 2: Line of code responsible for writing the second parameter of the OpenMutex call on the console during run-time (source).
After executing the Frida-trace again with the same parameters, it will read the changes from the JavaScript file and write the result on the console. As observed, the name of the opened mutexes is listed.
Figure 3: Mutex accessed by the malware during its execution (source).
As described in this article, Frida-trace is a great way to initially benefit from the Frida framework, but writing our script is also possible and more effective. Monitoring memory when malware injects malicious code is a key point during a malware analysis task.
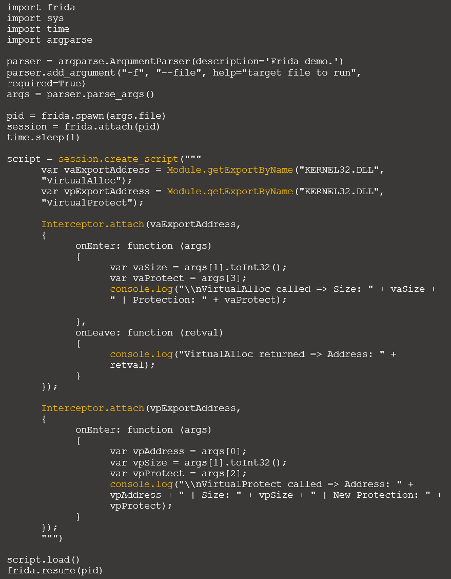
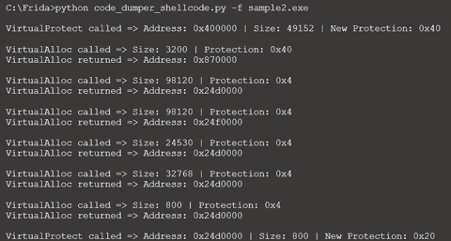
As demonstrated below, tracing the memory injection technique is possible with an initial script. In detail, the "VirtualAlloc" and "VirtualProtect" Win calls are monitored, and their content is shown when triggered.
Figure 4: Tracing memory calls with Frida (source).
This approach allows us to understand every time a new memory region is changed, its protection, and so on.
Figure 5: Result of the memory trace with Frida (source).
More details about this scenario can be found here [1] and [2].
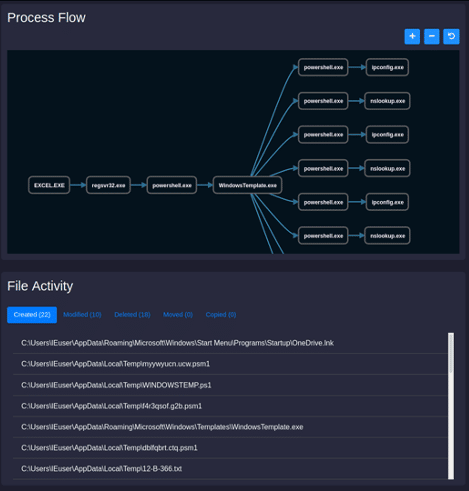
A framework called HawkEye was developed to automate the usage of Frida during a malware analysis and is available on GitHub. Depending on its goals, a user can add other functionalities and functions to parse as the source code is clean and easy to modify. In sum, this framework allows by default tracing some calls, namely:
- CreateProcessInternalW
- OpenProcess
- VirtualAllocEx
- CreateFile
- WriteFile
- MoveFile
- CopyFile
- DeleteFile
- RegCreateKey
- RegOpenKey
- RegQueryValueEx
- RegSetValueEx
- RegDeleteValue
- InternetOpenUrl
- GetAddrInfo
- LoadLibrary
- GetProcAddress
- CreateMutex
Figure 6: Process flow of HawkEye framework after analyzing a malware sample.
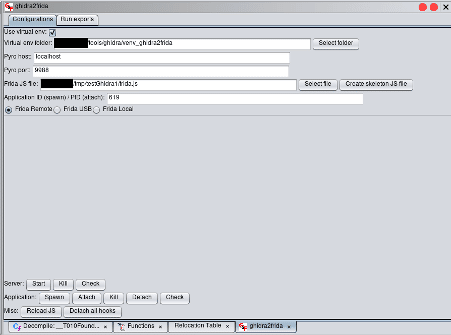
Also, an extension for Ghidra was released (ghidra2frida). It works as a bridge between Ghida and Frida and allows Frida to create scripts directly executed by Frida's dynamic engine to improve Ghidra's statical analysis features.
Figure 7: Example of ghidra2frida workflow window.
More details on how to use this extension can be found here.

Learn Python for Pentesting
Using Frida
Frida-trace is one of Frida's potent command-line tools, a great start point to collect details and interrogate Windows API calls efficiently. A DBI framework can be useful for collecting artifacts during a dynamic malware analysis task. With this kind of approach, bypassing malware restrictions is also possible, as users can customize and modify the processes' internals in run-time.
Another benefit of using Frida is that it is well-documented, easy to use and the creation of new scripts is very straight. Let's beat malware with Frida tools.
Sources
- ghidra2frida, humanativaspa
- Binary Instrumentation with Frida, GitBook - Segurança-Informática
- HawkEye tool, GitHub
- Malware Analysis with DBI, Blackberry

