Debugging for malware analysis
This article provides an overview of debugging and how to use some of the most commonly used debuggers. We will begin by discussing OllyDbg; using it, we will explore topics such as setting up breakpoints, stepping through the instructions and modifying the flow of execution.
We will then discuss WinDbg, which can be used for both user mode and kernel mode debugging.
Basics of debugging using OllyDbg
In this article, we will begin with OllyDbg to understand debugging concepts. OllyDbg is a popular and powerful Windows debugger for malware analysis. The best part is, it’s free. OllyDbg can be downloaded from http://ollydbg.de/. It should be noted that OllyDbg supports only user-mode debugging.
The best way to learn reverse engineering is by reverse engineering. Pick a target and attempt to crack it. Since this is an introductory article, where we’re going to understand the basics of debuggers, let's use a simple crackme challenge binary as our target. The target binary can be downloaded from https://crackmes.one/.
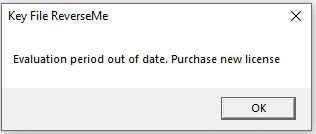
During the process of cracking this challenge, we will understand various concepts of debuggers. When we run this crackme, we will see the following message. Our goal is to bypass this evaluation period warning by reversing this binary.
There are two ways we can start reversing a binary:
- Open the application using the debugger and start it
- Start the application and attach debugger to the running process
We are going to use method 1 in this case.
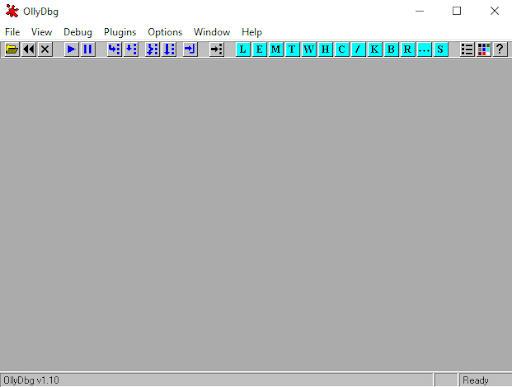
To launch OllyDbg, right-click on the OllyDbg application and click on Run as Administrator. This will launch OllyDbg, which looks as shown below.
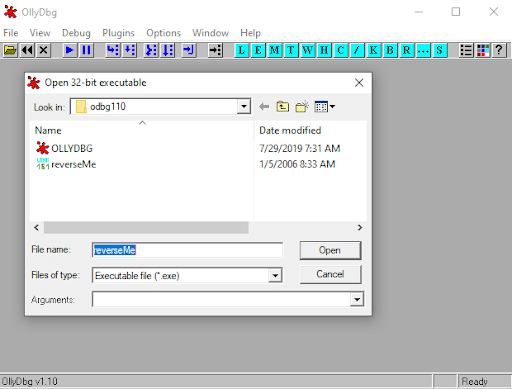
Next, navigate to File | Open and choose the target binary as shown below.
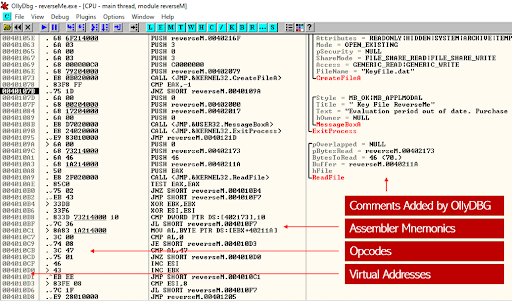
Click Open and it should open the target binary in OllyDbg, as shown below.
The preceding figure shows various sections of the top left part of the window. Before we proceed further with cracking our challenge, let’s understand some important topics in debugging.
Single-stepping
During malware analysis and reverse engineering, we may need to execute code line-by-line to understand the behavior at a certain point. Debuggers allow us to single-step the program execution. In OllyDbg, we can do single-stepping by using the F8 key (it should be noted that these shortcut keys can be customized) or by clicking the button highlighted in the figure below.
This button is used for step-over. This means the single-stepping happens per line of code. However, if we press this key when the debugger is about to execute a CALL instruction, the execution of the subroutine will be completed and the single-step continues to the next instruction after the CALL instruction.
If you want to single-step through the instructions inside the su routine, we should use step-into on the CALL instruction. In OllyDbg, this can be done by using the F7 key or the button highlighted below.
Breakpoints
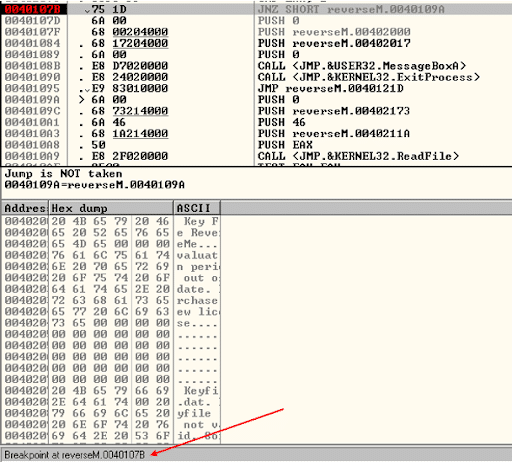
If we want to stop execution at a given address to be able to continue single-stepping from there, that can be done using breakpoints. A breakpoint allows us to instruct the debugger to interrupt the execution of the code at a specified address. Let us assume that we want to set a breakpoint on the line highlighted in gray below.
We can do it by using the F2 key or by giving a right-click anywhere on the highlighted line and choosing Breakpoint | Toggle. After setting a breakpoint, continue execution of the program and the execution will be stopped at the address where we set up a breakpoint earlier. If we want to remove the breakpoint, we can repeat the same step that is used for setting up a breakpoint one more time.
After running the program, once the breakpoint is hit, we will see the execution being stopped along with a breakpoint message.
Exceptions
Another important concept to note is exceptions. Exceptions can be caused by accessing an invalid memory location or performing any operation that causes an exception. Some malware authors cause unnecessary exceptions intentionally just to confuse and waste the time of reverse engineers. For instance, when a debugger is attached, the malware can cause an exception using Structured Exception Handler (SEH), which is a common anti-debugging technique in Windows malware.
Modifying execution
During malware analysis, it may be necessary to control the flow of execution of the malware being analyzed. A sample use case is that some malware detects virtual machines, and the malware will stop executing when it detects a virtual machine. In such cases, we will need to patch the binary to be able to prevent VM detection so that we can analyze the sample.
Using a debugger like OllyDbg, it is possible to modify the flow of execution of the binary being analyzed. This can be done by modifying the instructions in the binary.
To better understand this with an example, let’s switch back to cracking our challenge. Currently, we have loaded the target binary into OllyDbg. If we continue to execute it, it will through a warning.
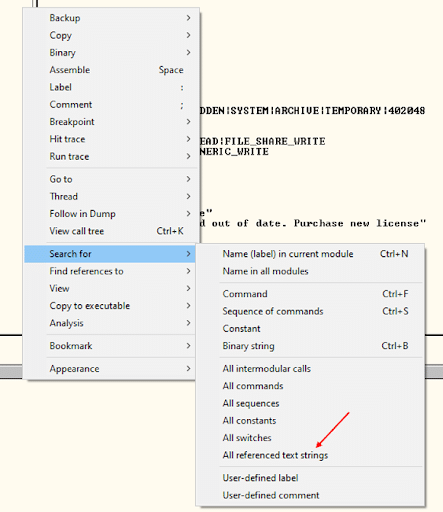
Let’s find out an address that gives some good news instead of a warning. To do this, let us find all the text strings available in the binary. This can be done by right-clicking and then navigating to Search for | All referenced text strings. This is shown below.
This will show us the following window with the text strings.
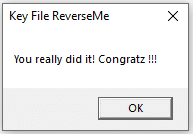
There is a string which says “You really did it! Congratz !!!” Let’s find out where this is getting executed. We can go to its respective assembly code by giving a double-click on the string, as shown below.
Our goal is to reach this block and get this message box executed instead of the warning message we were receiving earlier. Let’s copy the address of the PUSH 0 instruction by giving a right-click and navigating to Copy | To Clip Board. Now paste it in a notepad and note down the address of the instruction. In this case, the address is 00401205.
Now let’s set a breakpoint at the JNZ SHORT instruction, which is available just before the warning message. We’re doing this because this is the instruction which is deciding whether the instructions that are showing the warning message box should be executed or not.
Continue to run and the breakpoint will be hit. Once the breakpoint is hit, double-click on the JNZ SHORT instruction and modify it as shown below.
Click Assemble, followed by Cancel. Finally, continue to run the application and you should see the following.
Congrats, you have successfully modified the flow of the program.
Using WinDbg preview
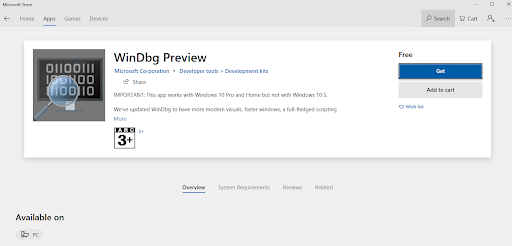
Now let’s see a quick introduction to another popular debugger called WinDbg. WinDbg is a popular debugger used for both user mode and kernel mode debugging. WinDbg has a graphical user interface version called WinDbg Preview, which can be downloaded from the Windows app store.
According to Microsoft’s documentation, “WinDbg Preview is a brand-new version of WinDbg with more modern visuals, faster windows, a full-fledged scripting experience, built with the extensible debugger data model front and center. WinDbg Preview is using the same underlying engine as WinDbg today, so all the commands, extensions, and workflows you're used to will still work as they did before.”
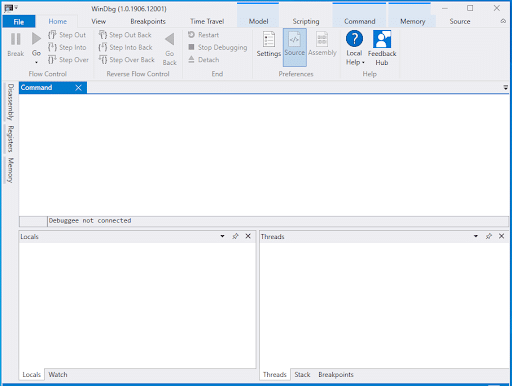
Let’s download WinDbg Preview and launch it. This looks as shown below.
Navigate to File | Launch Executable and choose our target binary.
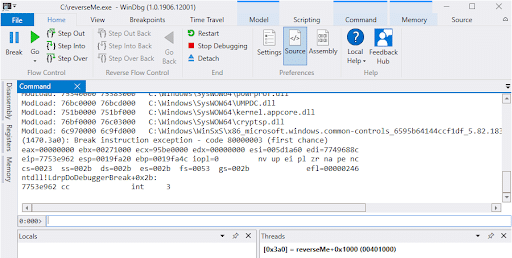
When we launch the executable using WinDbg, the execution is paused and we would not see anything being run.
If we want to perform debugging using WinDbg Preview, either we can use the GUI options available or we can use the command-line options.
To continue running the application, enter the command g and hit enter. This looks as shown in the following figure.
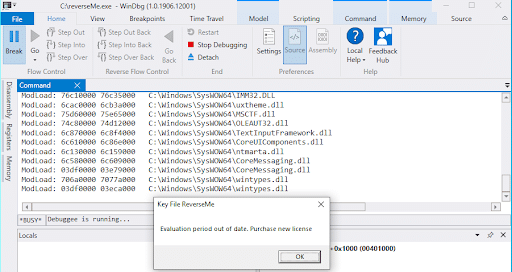
Once the execution resumes, we should be able to see the target app running as shown below.
Like we did with OllyDbg, we can also use WinDbg for single stepping through the instructions. This can be done using the command line option p or we can use the GUI button shown below.
Similarly, we can view the disassembly, set breakpoints and modify control flow using WinDbg. Regardless of which debugger we use, the debugging features will mostly remain the same.
The real power of WinDbg can be seen when performing kernel debugging, as most of the other debuggers only support user mode code. We can use WinDbg to debug the Windows kernel.
Introduction to Windows kernel debugging
More sophisticated malwares such as rootkits usually inject code into kernel drivers, which can be challenging during analysis. In this section, let’s discuss how we can set up our environment to begin with kernel debugging.
To be able to perform Windows kernel debugging, we need two machines. The first machine, which typically runs as a virtual machine, acts as a debuggee and the second machine (host machine) contains the debugger and is used for monitoring/debugging the debuggee.
The target machine should be configured for debugging. This can be done by running the following commands:
We have enabled debugging and configured debugging over the network. 192.168.1.71 is the host machine and we chose to use the port 55123. Finally, we have enabled testsigning for debugging. We should take note of the key we have gotten in the second command. This is going to be used when connecting from the debugger.
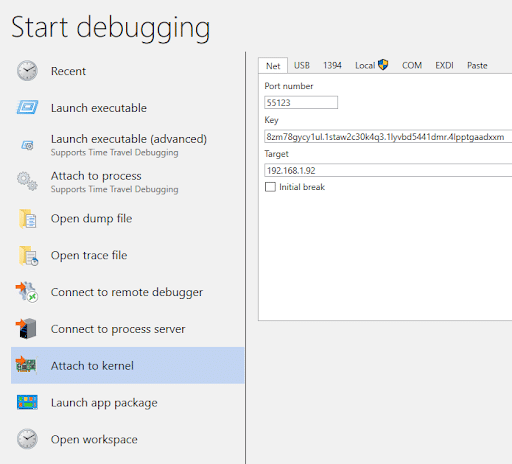
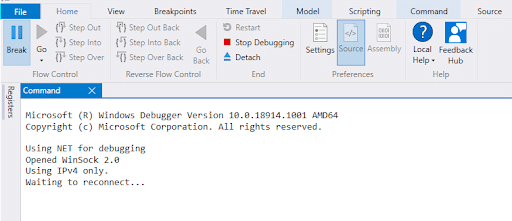
Switch to the host machine, launch WinDbg and navigate to File | Attach to Kernel. Enter the required details as shown below.
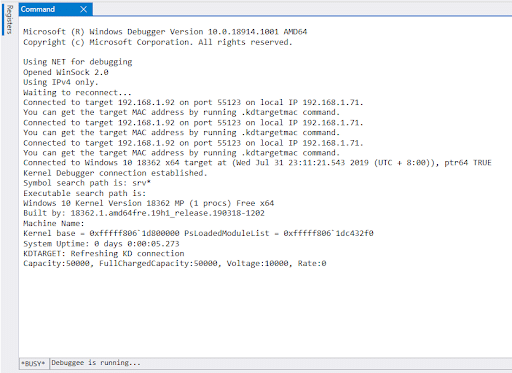
We have entered port 55123, which we configured earlier on the target machine using bcdedit. The key was also noted down earlier and we have entered the IP address of the remote machine being debugged. Finally, click OK and we should see the following:
Now reboot the target machine as the debugger connects to the remote machine’s kernel at boot time.
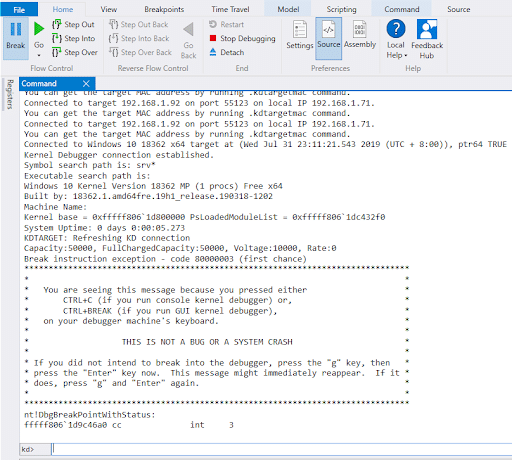
If you notice the bottom of the preceding figure, it says “Debuggee is running.” To start the console and pause the guest, press the Break button highlighted below.
After pressing the Break button, we should see a kd console where we can run commands. This is shown below.
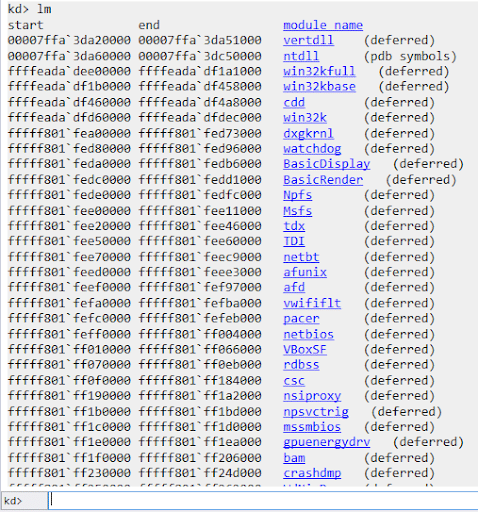
Now we can start debugging by running various debugger commands. The command lm for instance provides us the list of modules loaded, as shown below.
Introduction to Radare2
Radare2 is a command line framework for reverse engineering. Radare2 can be downloaded here.
Download the Windows installer and install Radare2. When the Radare2 framework is installed, some additional utilities such as Rabin2 and Radiff2 will be installed along with Radare2.
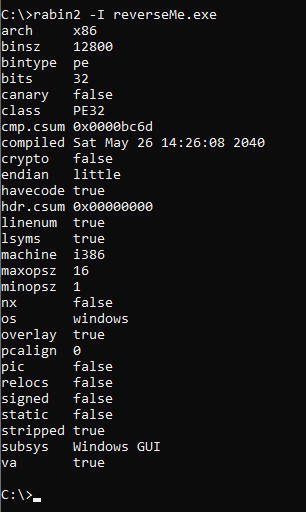
The following figure shows how Rabin2 can be used to obtain information about the target binary.
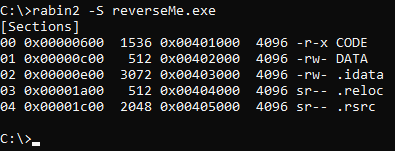
Similarly, we can use -S to obtain various sections of the executable. This is shown below.
We can run the following commands in the same order to analyze the binary using Radare2 and get a visual view.
aaa
V
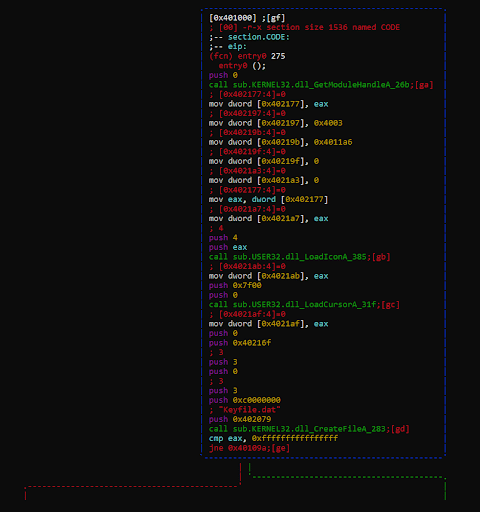
VAfter running the above we can see the control flow graph, as shown below. The following figure shows the block with the entry point of the target binary and it has branches to two other code blocks.
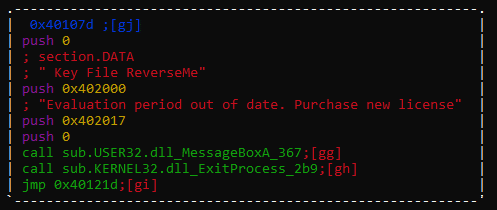
The branch that is colored red jumps to the code which shows us the “license out of date warning” we saw when using OllyDbg.
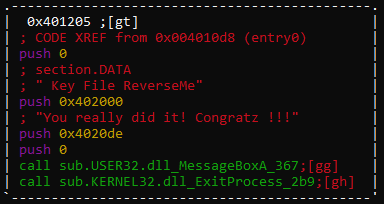
We can scroll down further to understand more about the binary in order to analyze it further using Radare2. For instance, the following block shows the congrats message, which is our end goal in cracking the target binary.
This article is not a deep dive or how-to-use guide of Radare2, but we just wanted to take a quick glance at how this can be an option in reversing binaries. Radare2 supports all the common debugging features such as breakpoints and single-stepping, and it can be used for both 32-bit and 64-bit binaries.
Want to learn more about debugging? Check out our debugging skills course!
Conclusion
In this article, we discussed some of the popular debuggers and most commonly used debugging features. We also took a quick look into how to use WinDbg Preview for both user mode debugging and kernel mode debugging. We also discussed how we can set up a Windows kernel debugging lab using WinDbg. Finally, we had a quick look at Radare2.

Become a certified reverse engineer!
Sources
- Debugging Using WinDbg Preview, Microsoft
- Setting Up Kernel-Mode Debugging, Microsoft
- Radare: A commandline framework for reverse engineering ala *nix-style, Radare


