Android hacking: Dumping and analyzing application’s memory
In this article, we will discuss how to dump the memory of a specific application using Android Studio's heap dump feature. We will also explore EclipseMemoryAnalyzer(MAT) to analyze the heap dump we acquire.
It is possible to create heap dumps of an application's heap in Android. We can dump this heap and use it for further analysis using tools like EclipseMemoryAnalyzer tool. But, these dumps are in binary format and cannot be parsed by EclipseMemoryAnalyzer tool directly. We need to convert these files into a standard format that can be parsed by EclipseMemoryAnalyzer. This can be done using a tool called hprof-conv that comes with Android SDK.

FREE role-guided training plans
Let's begin!
Let's first take a sample target application, install it on the emulator and insert some data as shown below.

This sample app uses SharedPreferences to store the data inserted by the user.
Now, open up Android Studio and navigate to Tools -> Android -> Android Device Monitor
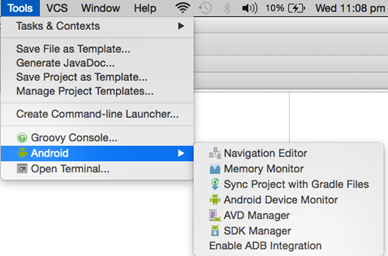
This will open up Android Device Monitor window. Now, select the emulator where your target application is running and then choose the target package. Now, click on "Update Heap" and "Dump HPROF File" icons respectively.
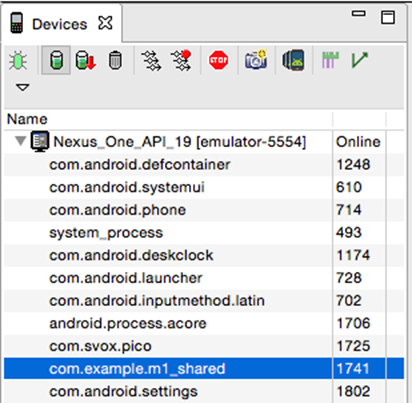
Clicking on "Dump HPROF File" icon will launch a window asking you to save the heap dump as shown below.
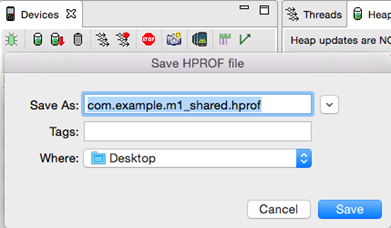
Now, download EclipseMemoryAnalyzer tool from the following link and launch it.
http://www.eclipse.org/mat/downloads.php
Now, try to open the hprof file that we have just got from Android Studio. EclipseMemoryAnalyzer won't be able to parse it and throws an error as shown in the figure below.
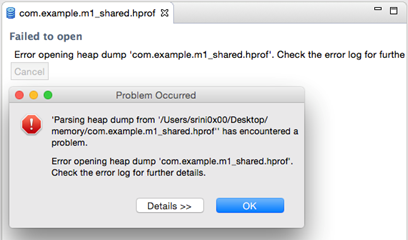
Using hprof-conv command line tool, we can convert this hprof file into a standard format that can be parsed by MAT.
As mentioned earlier, hprof-conv tool comes with Android SDK, and it is available inside
the
platform-tools
directory.
We can use the following command to convert the hprof file into a standard format.
$ hprof-conv <in file> <out file>
$
Following is the command in our case.
$ hprof-conv com.example.m1_shared.hprof memory.hprof
$
If everything goes fine, we should be able to open this memory.hprof file using MAT.
Open up the file in MAT.

Now, click "Dominator tree" icon to see the dump as shown in the following figure.
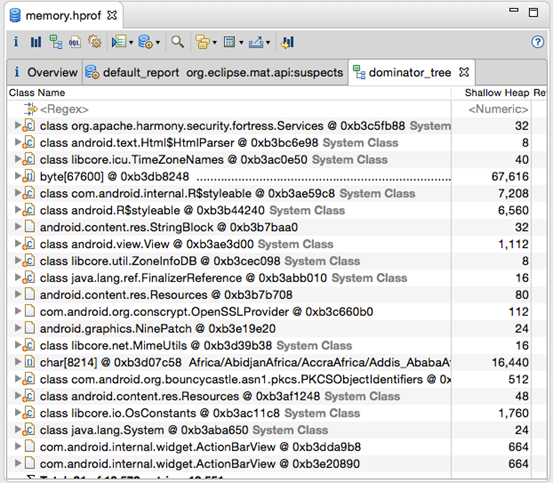
As you can see at the top, we have the option to perform regex search. We can search for specific keywords using this search option.
Let's begin with searching using the package name of our target application, and see if we can find anything interesting.
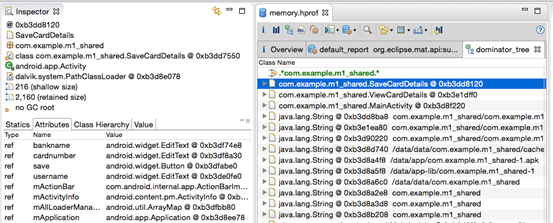
As you can see in the bottom left corner, we can see some application related objects such as bankname, cardnumber, save, username, etc.
At the beginning of this article, we have entered some details into the application. Let's see if anything is available in the memory by searching for the keywords we entered.
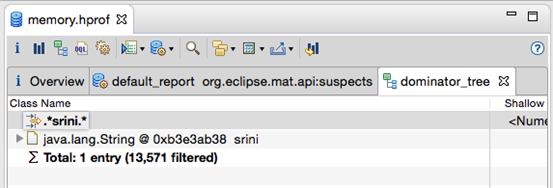
As we can see in the above figure, we are searching for the keyword "srini."

What should you learn next?
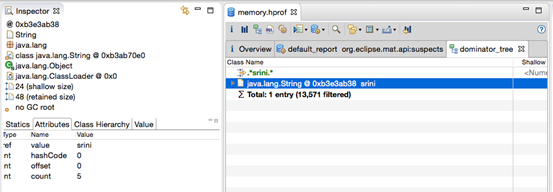
The above figure shows the string "srini" found in the memory. This is one way to explore interesting information in Application's memory.


