Stack based buffer overflow tutorial, part 1 - Introduction

This tutorial, in three parts, will cover the process of writing a simple stack based buffer overflow exploit based on a known vulnerability in the Vulnserver application.

FREE role-guided training plans
Vulnserver is a Windows server application with a number of exploitable vulnerabilities deliberately engineered in, and was designed to act as a target application to teach and practice basic fuzzing, debugging and exploitation skills. More information on Vulnserver, including a download link, is available here:
http://grey-corner.blogspot.com/2010/12/introducing-vulnserver.html
This tutorial covers how to confirm that a particular type of stack based overflow vulnerability is exploitable, as well as how to actually develop the exploit. The process of discovering vulnerabilities however is not covered in this tutorial. To learn one method by which such vulnerabilities can be discovered, you can check out a previous Vulnserver related article on fuzzing, available here:
/fuzzer-automation-with-spike/
This tutorial will also assume that the reader has a reasonable level of skill in using the OllyDbg or Immunity Debugger debugging applications, as well as a basic knowledge of X86 assembly language. For those who are new to these debuggers, or who may feel they need a refresher in assembly, the required skills are covered in the following links:
/debugging-fundamentals-for-exploit-development/
/in-depth-seh-exploit-writing-tutorial-using-ollydbg/
System requirements and setup
The following software is required to follow along with this tutorial:
- A 32 bit Windows System. I would suggest sticking to reasonably recent windows desktop systems such as Windows XP SP2 and up, Windows Vista or Windows 7, as these are the systems that I have personally tested. Windows 2000 desktop and server based systems may also work, but there are no guarantees.
- Vulnserver on your Windows system. You can obtain information about the program (which should be read before use) and download it from here: http://grey-corner.blogspot.com/2010/12/introducing-vulnserver.html
- OlldyDbg 1.10 on your Windows system. You can also use Immunity Debugger if you prefer, but just keep in mind your screenshots will appear slightly different to mine. OllyDbg can be obtained here: http://www.ollydbg.de/
- An instance of the Perl script interpreter. You can run this on either your Windows machine or on a Linux attacking system. Linux systems should already have Perl preinstalled, but if you want to run it on windows you can obtain a Perl install for free from here: http://www.activestate.com/activeperl
- A recently updated copy of Metasploit 3. You can again run this on either your Windows machine or on a Linux attacking system, although I recommend running it on a Linux system. See the following paragraphs for more detail. If you run BackTrack 4 R2 for an attacking system, as suggested below, Metasploit is included. Otherwise Metasploit can be obtained for Windows and Linux from here: http://www.metasploit.com/
My personal setup while writing this tutorial was to execute Metasploit commands and run my exploit Perl scripts from a Linux Virtual Machine running BackTrack 4 R2. This means that command syntax provided in this document will be for Linux systems, so if you are following along on Windows you will have to modify your commands as appropriate. I have chosen to run Metasploit and Perl from Linux because components of the Metasploit framework can be broken by many of the common Anti Virus solutions commonly installed on Windows systems. In addition, firing up a BackTrack VM which already includes Metasploit and Perl can be much quicker than manually installing Perl and Metasploit on your Windows system, especially if you already have a BackTrack environment handy.
If your Windows system is running a firewall or HIPS (Host Intrusion Prevention System), you may need to allow the appropriate traffic and disable certain protection features in order to follow this tutorial. We will be creating an exploit that makes Vulnserver listen for shell sessions on a newly bound TCP port, and firewalls and possibly HIPS software may prevent this from working. Certain HIPS software may also implement ASLR, which could also be problematic. Discussing firewall and HIPS bypass techniques is a little beyond the scope of this tutorial, so configure these appropriately so they don't get in the way.
I am also assuming for the purposes of this tutorial that your Windows system will not have hardware DEP enabled for all programs. The default setting for Windows XP, Windows Vista and Windows 7 is to enable hardware DEP for essential Windows programs and services only, so unless you have specifically changed your DEP settings your system should already be configured appropriately. See the following links for more information:
http://en.wikipedia.org/wiki/Data_Execution_Prevention
http://support.microsoft.com/kb/875352
My Windows Vulnserver system will be listening on the address 192.168.56.1 TCP port 9999, so this is the target address that I will use when running my Perl scripts. Make sure you replace this with the appropriate values if your Vulnserver instance is running elsewhere.
Assessing the vulnerability
The vulnerability we will be attempting to exploit is a stack based buffer overflow in the parameter of the TRUN command of Vulnserver. We can trigger an exception in the program by sending a TRUN command with a parameter consisting of a very long (~2000 characters or more) string including at least one full stop character. To demonstrate this, we can use the following script, which will send "TRUN ." followed by 3000 "A" characters to a specified IP address and port provided as command line parameters.
As we progress through the exploit development process, we will slowly modify this basic POC script into a full blown exploit. Save this as trun-exploit-vs.pl.
#!/usr/bin/perl
use IO::Socket;
if ($ARGV[1] eq '') {
die("Usage: $0 IP_ADDRESS PORTnn");
}
$baddata = "TRUN ."; # sets variable $baddata to "TRUN /.:/"
$baddata .= "A" x 3000; # appends (.=) 3000 "A" characters to $baddata
$socket = IO::Socket::INET->new( # setup TCP socket – $socket
Proto => "tcp",
PeerAddr => "$ARGV[0]", # command line variable 1 – IP Address
PeerPort => "$ARGV[1]" # command line variable 2 – TCP port
) or die "Cannot connect to $ARGV[0]:$ARGV[1]";
$socket->recv($sd, 1024); # Receive 1024 bytes data from $socket, store in $sd
print "$sd"; # print $sd variable
$socket->send($baddata); # send $baddata variable via $socket
Now Open vulnerver.exe in OllyDbg and hit F9 to let it run. Then, execute the script as follows to generate the exception within the debugger.
stephen@bt:~$ perl trun-exploit-vs.pl 192.168.56.1 9999
Welcome to Vulnerable Server! Enter HELP for help.
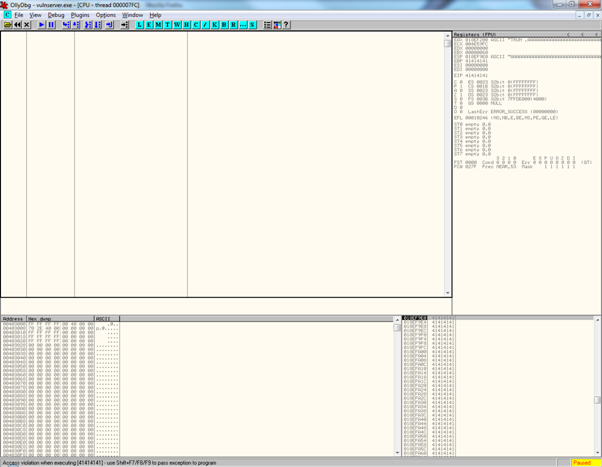
You should be greeted with the following in the debugger – an Access violation error will be shown at the bottom of the screen, and execution of the program will be paused within the debugger.
Once we have managed to generate an exception in a program, the first question that we will ask ourselves as exploit writers is "Can this be exploited?" The most direct answer to this question that I can give is so straightforward as to appear almost useless at first glance, and that is that an exception causing bug can be exploited if we can manage to write a working exploit for it.
While this statement may seem so obvious that it's redundant, a number of things need to go right for exploitation to be possible, and problems that may prevent exploitation may not become apparent until part way through the development process. That is why we cannot immediately confirm that a bug will be exploitable just by examining it, and why the completion of a working exploit is the only sure fire way to be sure exploitation is possible.
At a high level, there are a number of requirements to be met to allow the exploitation of overflow style bugs: We need to:
- Get control of the EIP register which controls which code is executed by the CPU, setting it to a value of our choosing,
- Identify some code that will fulfill our goals for the exploit, and either find it on the target system or insert it into the program ourselves using the exploit, and
- Redirect EIP towards our chosen code.
There are a number of different techniques for achieving each of these goals. The more techniques that we are aware of, the more options we have to choose from and the more bugs we will be able to exploit. In this tutorial, we will look at some of the simpler techniques for achieving each of these goals, leaving some of the more difficult ones for future tutorials.
Seeing that the first step in the exploitation process is always to somehow get control of EIP though, this acts as the first criteria to confirm in order to see if further examination is warranted. Now for some exploits, EIP control is achieved through some fairly subtle means, but in this particular case, we have a very obvious indicator that we have taken control of the EIP register.
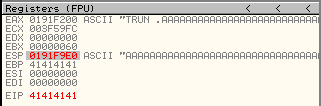
If we zoom in on the register pane in the CPU view when the exception is generated, we will see the following.

That value of EIP we see above is particularly interesting, as it is populated with four 41 bytes, and the ASCII equivalent of 41 is actually an "A" – the very same character that we sent large numbers of to the application in order to cause this exception. 41414141 is not a valid memory address, so there is no way this would have happened during normal program execution, so it appears likely that the content we sent has been used to directly set the value of EIP. The additional detail provided next to the EAX and ESP registers, which are used to point to the outcome of external functions and the top of the stack respectively, also indicate that our provided content was used to set EIP. If you check your stack pane, you will also see a large block of 41 characters there too.
These are all very strong indicators that a stack overflow leading to control of EIP has occurred, and based on this we can assess this vulnerability as being worthy of further investigation.
Before we continue with our examination of the exploit writing process however, it may be worth looking further at the gory details of stack overflows so you can fully appreciate how they actually occur.
Understanding stack overflows
So that you understand exactly what happens during a stack overflow, we will now track down the instructions in memory leading to this exception and step through them, explaining how the overflow affects the value of the EIP register.
We will start by using the Run trace functionality in OllyDbg to locate the appropriate instructions.
Before we start, make sure that the "Always trace over system DLLs" and "Always trace over string commands" options are enabled under OllyDbgs debugging options (Options menu, Debugging options, Trace tab).
Now open the Debug menu and select Restart to restart the program in the debugger, and hit F9 to start the program running.
To effectively use Run trace, we need to find a section in the code close to, but not after, the point where our exception occurs. Since the TRUN command is related to the exception, let's look for references to that in the code to see if one of the related instructions can act as an appropriate point to start our Run trace.
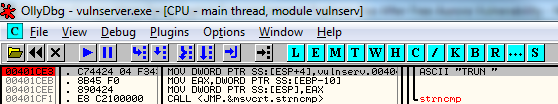
Right click in the disassembler pane in OllyDbg and select Search for->All referenced text strings. In the list of referenced text strings, find the entry about halfway down the list that indicates a reference to the ASCII string "TRUN " and double click on it to go there in the disassembler pane. Now hit F2 to set a breakpoint at this instruction. You should see the following in your disassembler pane.
Note: The debugger tasks I am performing right now have been explained in detail in the Debugging guide I linked to in the Introduction. If you are getting lost right now I'd suggest going back and reading that guide before proceeding.
Now run our exploit again.
stephen@bt:~$ perl trun-exploit-vs.pl 192.168.56.1 9999
Welcome to Vulnerable Server! Enter HELP for help.
Execution should pause at our breakpoint. From here, we will use Run trace to find out the instructions leading to our exception. Hit Ctrl-F11 to perform a "trace into" Run trace.
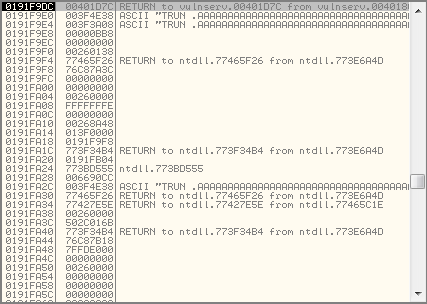
Once the exception is reached, dismiss the dialog that appears by hitting OK, and open the View menu, and select the Run trace option. The following will appear in your debugger, showing you the instructions leading up to this exception.
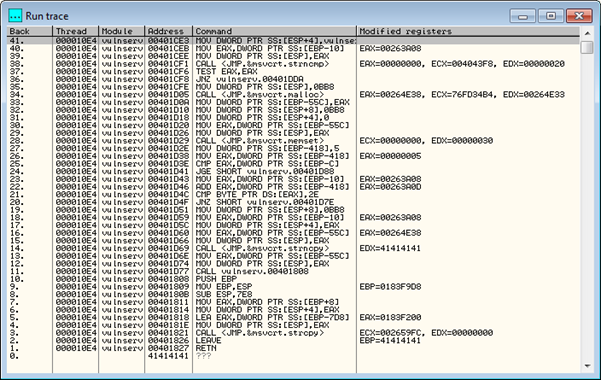
This shows us that the RETN instruction was executed immediately before our exception occurred (see entry 1 in the trace). Given that the RETN instruction takes the top value from the stack, interprets the value as an address and directs EIP to location, we can deduce that the 41414141 value stored in EIP came from the stack. This seems to fit with what we saw earlier - the stack was filled with lots of consecutive 0x41 bytes.
The RETN instruction is used to return back to the previous point in a programs execution after making a CALL statement, which places the address of the following instruction in memory onto the stack before it runs. Therefore, we can conclude that since the RETN statement is pulling an invalid value of 41414141 off the stack, the valid memory address placed onto the stack by the matching CALL statement must have somehow been overwritten during execution of the intermediary instructions. This is because an invalid memory address will not be placed onto the stack by a CALL instruction, and a properly working program will not allow a RETN instruction to run with an invalid address on the stack. Let's place a breakpoint at that CALL instruction and step through the code from there so we can see what is happening.
The appropriate CALL instruction is the entry with the number 11 in the Run trace window. Since we set the "Always trace over system DLLs" option in the Debugging options, the CALL to the system DLL listed in entry number 3 has actually been traced over, so you won't see its RETN instruction in the Run trace window. This means we need to find the next CALL statement to a non system DLL in our list to find the CALL that matches our RETN. This is entry 11. Double click on the "CALL vulnserv.00401808" text in entry 11 in the Run trace window to take you back to the CPU view.
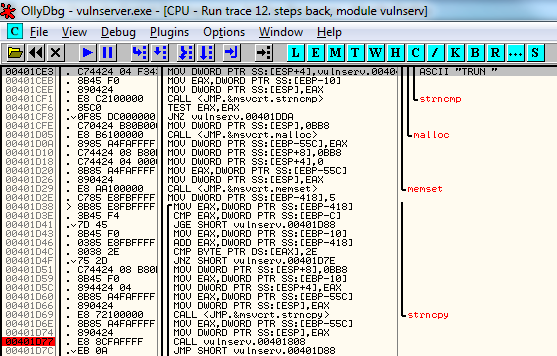
Now set a breakpoint on this instruction using F2, and clear the earlier breakpoint at address 00401CE3 by selecting the entry and hitting F2 once more. Your disassembler pane should now look as follows.
Restart the program in the debugger, and hit F9 to let it run. Now launch our exploit again.
stephen@bt:~$ perl trun-exploit-vs.pl 192.168.56.1 9999
Welcome to Vulnerable Server! Enter HELP for help.
Execution will now pause at our newly set breakpoint. We will now step through execution of our program to see what is happening to cause this exception.
Our debugger should now be paused on the following instruction
00401D77 |. E8 8CFAFFFF ||CALL vulnserv.00401808
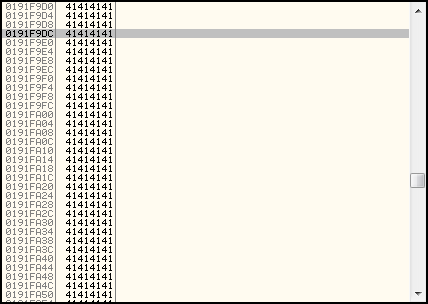
When executed, this instruction should place the address of the next instruction in memory (00401D7C) onto the stack and should then redirect execution to the address (00401808) specified in the CALL instruction. Take note of the stack pane in the debugger and hit F7 to step into this instruction. After the instruction has been executed you should see the address 00401D7C loaded onto the stack. See the screenshot below.
At this point, take a note of the address on the stack that stores our return address value. This was 191F9DC for me (see the highlighted entry in the screenshot above), but your address could be different, so make you record it, because we will be checking the data at this address again later.
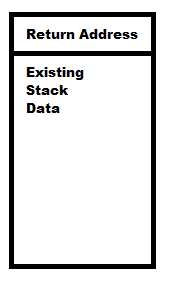
Conceptually, the stack now looks like this, with the return address from the CALL statement on top of the stack and all pre-existing stack data underneath.
Now use F7 three times to step into the following instructions.
00401808 /$ 55 PUSH EBP
00401809 |. 89E5 MOV EBP,ESP
0040180B |. 81EC E8070000 SUB ESP,7E8
These instructions push the current value of EBP onto the stack, copy the current value of the ESP register into the EBP register, and then subtract 7E8 (2024 in decimal) from the ESP register. You will notice that the stack pane is now filled with a large number of zeros – what this actually represents is free space that has been pre-allocated on the stack for use by this function.
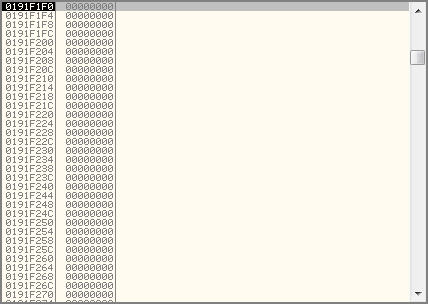
This space will be used to store parameters fed to other function calls, as well as to hold variables local to this function. When these local variables are actually written to memory, they will be written into this allocated space.
Conceptually, our stack now looks like the following.

Use F7 four times to step into the following 4 instructions.
00401811 |. 8B45 08 MOV EAX,DWORD PTR SS:[EBP+8]
00401814 |. 894424 04 MOV DWORD PTR SS:[ESP+4],EAX
00401818 |. 8D85 28F8FFFF LEA EAX,DWORD PTR SS:[EBP-7D8]
0040181E |. 890424 MOV DWORD PTR SS:[ESP],EAX
These instructions setup pointers on the stack to act as input to the function call that is about to be made.
If you look at the top of the stack now you will see something similar to the following.
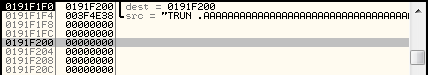
We have a memory address being interpreted as a destination operand at the top of the stack. The address given as this destination, 0191F200, is actually located a few places down on the stack, near the start of the remaining portion of that long section of zero bytes previously allocated on the stack for storage. You can actually see the stack entry at this address highlighted in grey in the screenshot above.
The second entry on the stack, interpreted as a source operand, is a pointer to another location in memory which contains the text "TRUN .AAAAAAAA", which is the data we sent to the application using our script.
So we have a destination address pointing to our pre-allocated space on the stack, and a source address containing the data we sent to the application. The function that will actually make use of these parameters is strcpy from msvcrt, as shown highlighted below.
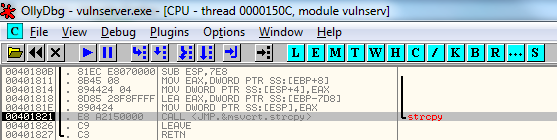
The strcpy function copies a string, terminated by a zero byte, from one location to another. The problem with strcpy however, is that it doesn't check that the location it is meant to copy the data to is actually large enough to store that data.
Press F8 to step over this instruction and see what happens.
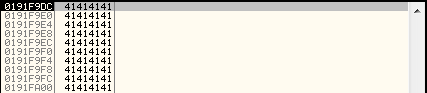
You should now notice that our stack pane shows that the stack is now full of 41 bytes, which is to be expected since we just performed a strcpy operation to copy a string with many "A" characters there. If we scroll down into stack pane, and look for the address we recorded earlier where our stored return address was placed, (191F9DC for me, your value may be different), we will notice that it no longer contains the return address from the earlier CALL instruction, and has instead been overwritten by strcpy with data provided by our script.
What we have actually done is write beyond the allocated storage space on our stack, so that the saved return address has been replaced with data that we sent to the program. Our conceptual diagram below shows in red how the data written by strcpy goes beyond the space set aside for it and overwrites some of the pre-existing stack data. At this point, we have a stack overflow.

Let's continue to follow the rest of the instructions until we see how this overflow results in an overwritten EIP register and a program exception. Press F7 to step into the following instruction.
00401826 |. C9 LEAVE
The LEAVE instruction copies the value in the EBP register to the ESP register, and also takes the current value on the stack and uses it to set the EBP register. Remember earlier when we ran those instructions to copy the value of ESP to EBP and we placed the EBP value onto the stack? The LEAVE instruction is meant to reverse those two steps, and has the effect here of setting the stack back to the same state as when we first made that original CALL statement. In theory, the return value placed onto the stack by the CALL statement earlier should now be stored in the top stack entry, allowing us to proceed onwards from the previous CALL statement when we execute RETN. We have already seen however, that this stack entry was overwritten by our strcpy call. This is how our stack now looks.
So what will happen when we execute the following RETN instruction, which redirects execution to the address stored on the stack?
00401827 . C3 RETN
Press F8 to step over the instruction and you will see that the EIP register now points to 41414141.
So we have now seen that the data we have sent to the application has been used to set the EIP register. By tracing this through, we have also seen how the EBP register also gets set from the data we send, and how the ESP register also ends up pointing to data which was sent to the application.
We now know that we can fulfil the first, and arguably most important of the three criteria for successful exploitation mentioned earlier. Let's now check to see if we can manage the rest.
Take your hacking to the next level
Learn how to pentest and be an ethical hacker with expert-guided training, or learn more about the world of ethical hacking.
In the second article we will work on exploiting the stack overflow.


- 12 pre-built training plans
- Employer-requested skills
- Personalized, hands-on training
In this series
- Stack based buffer overflow tutorial, part 1 - Introduction
- CompTIA CySA+ Salary: What to expect in 2025
- How to become a cybercrime investigator
- CEH version comparison: V12 to V13 evolution guide
- SecurityX (CASP+) certification: Overview and career path [2025 update]
- Network+ certification: Overview and career path [2025 update]
- ISC2 CSSLP certification overview: What you need to know
- ISC2 CGRC: Overview & career path
- CRISC certification: Overview & career path [updated 2021]
- PMP certification: Overview and career path [updated 2021]
- ISACA CDPSE certification: Overview of the new ISACA privacy certification
- CGEIT certification: Overview and career path [updated 2021]
- What is a cyber range?
- Microsoft azure certification: Overview And career path
- CEH salary guide: What Certified Ethical Hackers really earn
- Average SecurityX (CASP+) salary [2025 update]
- CompTIA Network+ certification — A 2025 salary analysis
- CompTIA CySA+ exam (CSO-003): Your guide
- CCSP salary: How much can you make as a cloud security professional?
- Average Security+ salary (2025): Your guide to a prosperous cybersecurity career
- Average CGRC (Certified in Governance, Risk and Compliance) salary
- CRISC Frequently Asked Questions (FAQ) [updated 2022]
- Average CSSLP Salary in 2021
- ISACA CDPSE exam details and process
- How To Become CGEIT Certified – Certification Requirements [updated 2021]
- How to pick the best cyber range for your cybersecurity training needs and budget
- CEH exam eligibility: Application process & requirements guide
- SecurityX (CASP+) frequently asked questions (FAQ) [2025 update]
- CISSP domains overview: Your complete preparation guide
- CCSP exam and CBK changes in August 2024
- Comprehensive guide to CompTIA Security+ domains (2025)
- Average CRISC Salary [2023 update]
- CGRC certification job titles and career outlook
- ISC2 CSSLP exam details and process
- ISACA CDPSE certification exam: Overview of domains
- An Introduction to the PMP: Exam Details and Process [updated 2021]
- CGEIT certification exam: overview of domains [Updated 2021]
- 10 Success Tips: How to Pass Your Certified Ethical Hacker (CEH) Exam
- Network+: Exam details and process [2025 update]
- SecurityX (CASP+): Exam details and process [2025 update]
- How to become CCSP certified: Certification requirements
- Certified in Risk & Information Systems Control (CRISC) Exam Overview [updated 2022]
- ISC2 CGRC exam details and process
- Best CSSLP study resources and training materials
- ISACA CDPSE domain 1: Privacy governance
- 10 Tips for PMP Certification Exam Success [updated 2021]
- CGEIT certification exam details and process [updated 2021]
- Certified Ethical Hacker (CEH) study guides & resources [updated 2025]
- CompTIA SecurityX resources: Videos, books, tests and more!
- How to get the CompTIA Network+ certification: Requirements and step-by-step instructions [2025 update]
- CySA+ exam objectives: The 4 domains that will be covered
Get certified and advance your career!
- Exam Pass Guarantee
- Live instruction
- CompTIA, ISACA, ISC2, Cisco, Microsoft and more!
CompTIA CySA+
Discover the latest salary trends for CompTIA CySA+ certified professionals in 2024. Learn what factors influence your earning potential in the cybersecurity field.

Cybercrime investigator
Cybercrime has hit record levels, with an expected $7 trillion USD to be made from cybercriminal activity by 2021. Investigating these sorts of crimes can be

EC-Council CEH
CEH v13 is the world's first AI-powered ethical hacking certification. Discover what's new, how it compares to v12/v11 and why it's a career game-changer.

CompTIA SecurityX
Explore the expert-level CompTIA SecurityX certification, what to expect on the exam, the career benefits and more.
