Log analysis for web attacks: A beginner's guide
It is often the case that web applications face suspicious activities due to various reasons, such as a kid scanning a website using an automated vulnerability scanner or a person trying to fuzz a parameter for SQL Injection, etc. In many such cases, logs on the webserver have to be analyzed to figure out what is going on. If it is a serious case, it may require a forensic investigation.

Learn Web Server Protection
Apart from this, there are other scenarios as well.
For an administrator, it is really important to understand how to analyze the logs from a security standpoint.
People who are just beginning with hacking/penetration testing must understand why they should not test/scan websites without prior permission.
This article covers the basic concepts of log analysis to provide solutions to the above-mentioned scenarios.
Setup
For demo purposes, I have the following setup.
Apache server
– Pre installed in Kali Linux
This can be started using the following command:
service apache2 start

MySQL
– Pre installed in Kali Linux
This can be started using the following command:
service mysql start

A vulnerable web application built using PHP-MySQL
I have developed a vulnerable web application using PHP and hosted it in the above mentioned Apache-MySQL.
With the above setup, I have scanned the URL of this vulnerable application using few automated tools (ZAP, w3af) available in Kali Linux. Now let us see various cases in analyzing the logs.
Logging in the Apache server
It is always recommended to maintain logs on a webserver for various obvious reasons.
The default location of Apache server logs on Debian systems is
/var/log/apache2/access.log
Logging is just a process of storing the logs in the server. We also need to analyze the logs for proper results. In the next section, we will see how we can analyze the Apache server's access logs to figure out if there are any attacks being attempted on the website.
Analyzing the logs
Manual inspection
In cases of logs with a smaller size, or if we are looking for a specific keyword, then we can spend some time observing the logs manually using things like grep expressions.
In the following figure, we are trying to search for all the requests that have the keyword "union" in the URL.

From the figure above, we can see the query "union select 1,2,3,4,5" in the URL. It is obvious that someone with the IP address 192.168.56.105 has attempted SQL Injection.
Similarly, we can search for specific requests when we have the keywords with us.
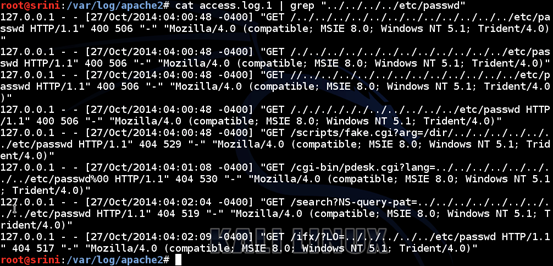
In the following figure, we are searching for requests that try to read "/etc/passwd", which is obviously a Local File Inclusion attempt.

As shown in the above screenshot, we have many requests trying for LFI, and these are sent from the IP address 127.0.0.1. These requests are generated from an automated tool.
In many cases, it is easy to recognize if the logs are sent from an automated scanner. Automated scanners are noisy and they use vendor-specific payloads when testing an application.
For example, IBM appscan uses the word "appscan" in many payloads. So, looking at such requests in the logs, we can determine what's going on.
Microsoft Excel is also a great tool to open the log file and analyze the logs. We can open the log file using Excel by specifying "space" as a delimiter. This comes handy when we don't have a log-parsing tool.
Aside from these keywords, it is highly important to have basic knowledge of HTTP status codes during an analysis.
Below is the table that shows high-level information about HTTP status codes.
Web shells
Web shells are another problem for websites/servers. Web shells give complete control of the server. In some instances, we can gain access to all the other sites hosted on the same server using web shells.
The following screenshot shows the same access.log file opened in Microsoft Excel. I have applied a filter on the column that is specifying the file being accessed by the client.

If we clearly observe, there is a file named "b374k.php" being accessed. "b374k" is a popular web shell and hence this file is purely suspicious. Looking at the response code "200", this line is an indicator that someone has uploaded a web shell and is accessing it from the web server.
It doesn't always need to be the scenario that the web shell being uploaded is given its original name when uploading it onto the server. In many cases, attackers rename them to avoid suspicion. This is where we have to act smart and see if the files being accessed are regular files or if they are looking unusual. We can go further ahead and also see file types and the time stamps if anything looks suspicious.
One single quote for the win
It is a known fact that SQL Injection is one of the most common vulnerabilities in web applications. Most of the people who get started with web application security start their learning with SQL Injection. Identifying a traditional SQL Injection is as easy as appending a single quote to the URL parameter and breaking the query.
Anything that we pass can be logged in the server, and it is possible to trace back.
The following screenshot shows the access log entry where a single quote is passed to check for SQL Injection in the parameter "user".
%27 is URL encoded form of a Single Quote.

For administration purposes, we can also perform query monitoring to see which queries are executed on the database.

If we observe the above figure, it shows the query being executed from the request made in the previous figure, where we are passing a single quote through the parameter "user".
We will discuss more about logging in databases later in this article.
Analysis with automated tools
When there are huge amount of logs, it is difficult to perform manual inspection. In such scenarios we can go for automated tools along with some manual inspection.
Though there are many effective commercial tools, I am introducing a free tool known as Scalp.
According to their official link, "Scalp is a log analyzer for the Apache web server that aims to look for security problems. The main idea is to look through huge log files and extract the possible attacks that have been sent through HTTP/GET."
Scalp can be downloaded from the following link.
https://code.google.com/p/apache-scalp/
It is a Python script, so it requires Python to be installed on our machine.
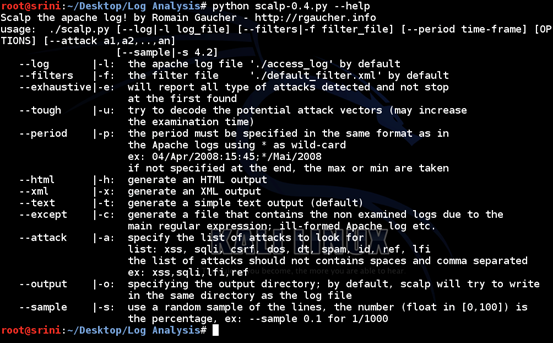
The following figure shows help for the usage of this tool.

As we can see in the figure, we need to feed the log file to be analyzed using the flag "–l".
Along with that, we need to provide a filter file using the flag "-f" with which Scalp identifies the possible attacks in the access.log file.
We can use a filter from the PHPIDS project to detect any malicious attempts.
This file is named as default_filter.xml and can be downloaded from the link below.
https://github.com/PHPIDS/PHPIDS/blob/master/lib/IDS/default_filter.xml
The following piece of code is a part that is taken from the above link.
[php]
<filter>
<id>12</id>
<rule><![CDATA[(?:etc/W*passwd)]]></rule>
<description>Detects etc/passwd inclusion attempts</description>
<tags>
<tag>dt</tag>
<tag>id</tag>
<tag>lfi</tag>
</tags>
<impact>5</impact>
</filter>
[/php]
It is using rule sets defined in XML tags to detect various attacks being attempted. The above code snippet is an example to detect a File Inclusion attempt. Similarly, it detects other types of attacks.
After downloading this file, place it in the same folder where Scalp is placed.
Run the following command to analyze the logs with Scalp.
python scalp-0.4.py –l /var/log/apache2/access.log –f filter.xml –o output --html
Note: I have renamed this file in my system to access.log.1 in the screenshot. You can ignore it.

'output' is the directory where the report will be saved. It will automatically be created by Scalp if it doesn't exist.
--html is used to generate a report in HTML format.
As we can see in the above figure, Scalp results show that it has analyzed 4001 lines over 4024 and found 296 attack patterns.
We can even save the lines that are not analyzed for some reason using the "–except" flag.
A report is generated in the output directory after running the above command. We can open it in a browser and look at the results.
The following screenshot shows a small part of the output that shows directory traversal attack attempts.

Logging in MySQL
This section deals with analysis of attacks on databases and possible ways to monitor them.
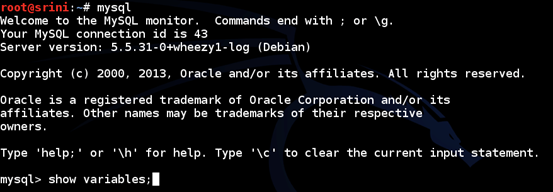
The first step is to see what are the set variables. We can do it using "show variables;" as shown below.

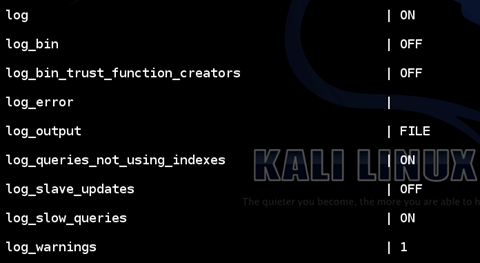
The following figure shows the output for the above command.

As we can see in the above figure, logging is turned on. By default this value is OFF.
Another important entry here is "log_output", which is saying that we are writing them to a "FILE". Alternatively, we can use a table also.
We can even see "log_slow_queries" is ON. Again, the default value is "OFF".
All these options are explained in detail and can be read directly from MySQL documentation provided in the link below.
http://dev.mysql.com/doc/refman/5.0/en/server-logs.html
Query monitoring in MySQL
The general query log logs established client connections and statements received from clients. As mentioned earlier, by default these are not enabled since they reduce performance. We can enable them right from the MySQL terminal or we can edit the MySQL configuration file as shown below.
I am using VIM editor to open "my.cnf" file which is located under the "/etc/mysql/" directory.

If we scroll down, we can see a Logging and Replication section where we can enable logging. These logs are being written to a file called mysql.log file.
We can also see the warning that this log type is a performance killer.
Usually administrators use this feature for troubleshooting purposes.

We can also see the entry "log_slow_queries" to log queries that take a long duration.

Now every thing is set. If someone hits the database with a malicious query, we can observe that in these logs as shown below.

The above figure shows a query hitting the database named "webservice" and trying for authentication bypass using SQL Injection.
More logging
By default, Apache logs only GET requests. To log POST data, we can use an Apache module called "mod_dumpio".
To know more about the implementation part, please refer to the link below. Alternatively, we can use 'mod security' to achieve the same result.

Learn Web Server Protection


