Memory and volatility
In this article series, we will learn about how processes reside in memory and various ways to find and enumerate them. I will be using Volatility plugins to find processes in memory. Once we know how to find processes within memory, in Part 2 we will see how to enumerate through them.
Note: The scope of this article is only limited to show how the process can be found & enumerated within memory. I will not cover any investigation/hunting of malicious processes in this article. Bonus points to you if you figure out suspicious processes from screenshots.

FREE role-guided training plans
Process in memory
Processes are represented in memory using the structure names _EPROCESS and each process has its own private virtual memory space that contains all the components needed to run the process like process executable, DLLs, stack, heap, etc. This is how it looks in Windows 7 32bit.
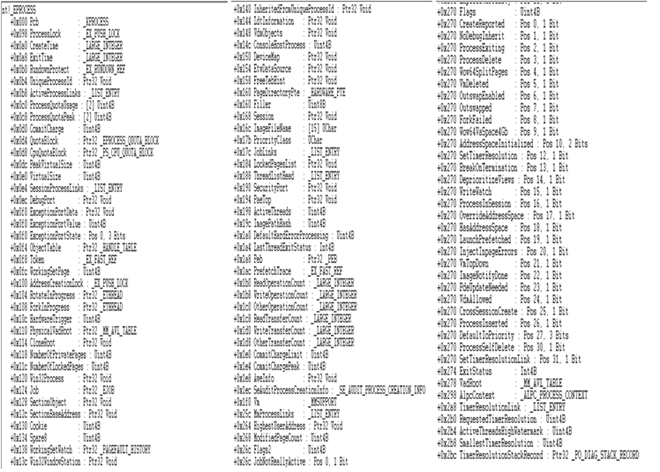
Now as we can see, there are lots of properties that constitute a process. Below are some of the important ones and will be handy to know during investigations
Ways to find processes in memory using volatility
As we see below, we give the profile type selection while running Volatility plugins because it tells the code running in the background to look at specific offsets and then start following pointers to get all the objects like Process. To enumerate process, Volatility first locates Kernel Debugger data block to find out PsActiveProcessHead which itself points to _EPROCESS list.

Following are different ways to enumerate process in memory that Volatility gives us I form of plugins:
pslist
This plugin will walk the linked list that is pointed by PsActiveProcessHead and is run by ActiveProcessLink. The _EPROCESS structure contains this _LIST_ENTRY structure named ActiveProcessLink. This doubly linked list is like below

Below is an example of the pslist in action:
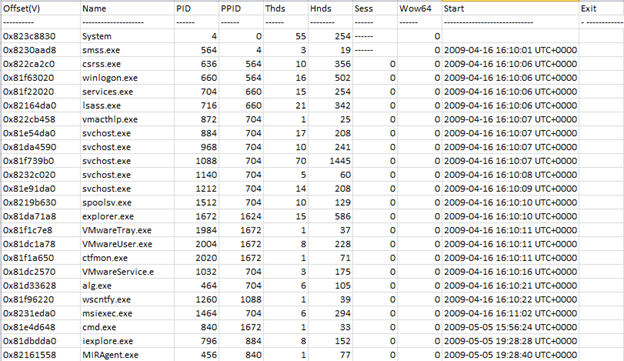
Take a look at the number of processes which were running in memory when the image was acquired. This plugin is useful to know which processes were there in the linked list and initial level triaging can be done here to look out for nay new unknown process or even a known process with a slightly different name like scvhost.exe and if possible try to map the parent of the child process though we have a better plugin for that pstree which we will discuss shortly.
psscan
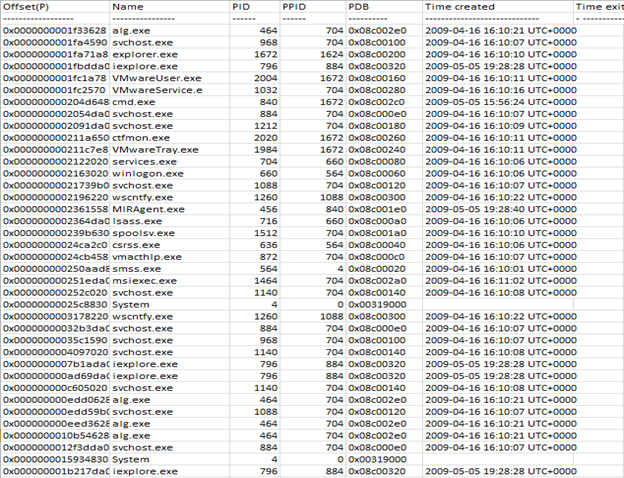
Like stated above, pslist can be defeated if the process can be unlinked from doubly linked list. This can be achieved using techniques like Direct Kernel Object Manipulation(DKOM). This can be done by loading a malicious driver which will full access to kernel objects or with API function called ZWSystemDebugControl. Below is an output of psscan plugin. As you can already see that the number of processes being listed are more than pslist since psscan walked the complete memory to extract what's related to Process object. Let's take a look at it.
psxview
This plugin is used to give an overall picture of the process so that cross reference can be done for various aspects to discover malicious processes. Below is an output of psxview
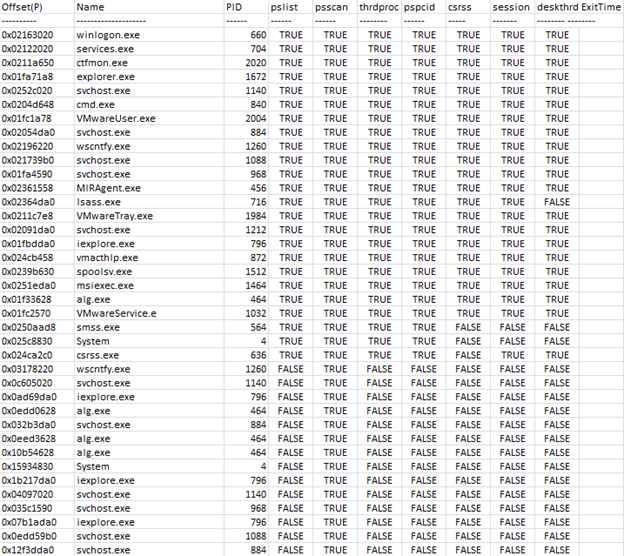
Let's examine the output now:
pstree
This plugin takes the output of pslist and actually present them in child-parent relationship. Very useful plugin when the process listing is huge within the memory to see any suspicious relationship between child-parent. For example in the output below of pstree, we can see the relationship with extending .'s defines the relation structure.
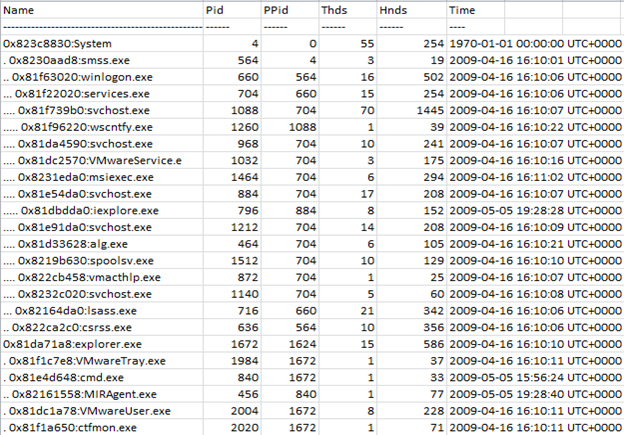
Note that this gives mapping of pslist output only so you can still miss the output knowledge from psscan in this. What are your thoughts on cmd.exe process here?

Get your guide to the top-paying certifications
With more than 448,000 U.S. cybersecurity job openings annually, get answers to all your cybersecurity salary questions with our free ebook!
So in this article, we have seen how processes can be found within memory, and their output can be transformed using Volatility plugins. In part 2 of this article series we will see how to enumerate the processes memory found in this article.


