Debugging Java Applications Using JDB
This article walks the readers through debugging Java programs using a command line tool called JDB. Though this article doesn't touch Android concepts, this is a prerequisite to understand the next article coming in the series, which is "Exploiting Debuggable Android Applications".
What is JDB?

What should you learn next?
JDB is a Java debugger, a simple command line debugger for Java classes. It comes preinstalled with JDK.
I am using an Ubuntu machine for this article, so we can locate JDB by navigating to /usr/bin directory as shown below:
cd /usr/bin
ls | grep jdb
Note: If you are using a Windows machine, it will be available in the bin directory of the Java path. This article is written for an Ubuntu machine, but all the techniques shown here are almost the same, even in Windows.
Introduction
In this article, rather than typing JDB commands blindly and looking at the usage, we'll take a sample Java application to understand how to use JDB commands based on the scenario. The whole idea is to understand JDB and its usage in debugging Java programs.
Below is the sample code I have taken as an example:
Name of the source code file: Debug.java
Class file generated: Debug.class
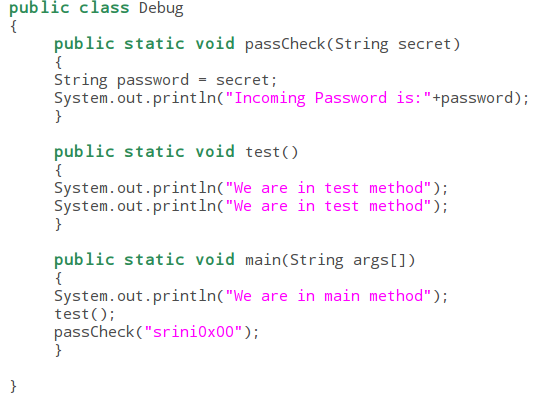
The code snippet shown above has two methods which are invoked from the main method of Debug class, and when we execute it after compiling, it shows the output as shown in the screenshot below, which is expected.

We have compiled our Java program with "–g" option so that we get some extra debugging information in the generated class file.
Running JDB
To debug Java applications, there must be a communication channel between JDB and JVM, since our Java program would run inside Java Virtual Machine.
There are multiple ways to connect JDB to JVM, as shown below.
Method 1
In this method, we can directly load our class file into JDB. JDB will automatically start JVM and a connection will be established.

Debug is the class file generated after compiling the source code.
Method 2
In this method, we first launch the JVM using the following command so that JVM will start listening on port 54321.
java -Xdebug -Xrunjdwp:transport=dt_socket,server=y,address=54321 Debug

Then start JDB using the following command to connect to the JVM on port 54321.
jdb -attach 54321
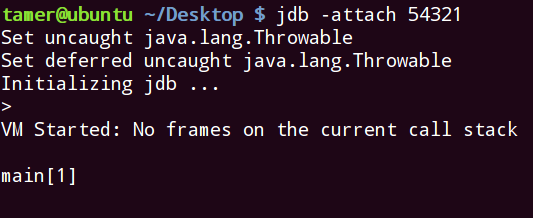
This second method can be used to do remote debugging also. We will use remote debugging in the next article to exploit debuggable Android applications. In this article we will use method 1 to cover both the flavors.
Beginning with Debugging
Let's start debugging the sample Java application using method 1 by invoking JVM directly with JDB. But, to start JVM, we need to explicitly give the command "run" as shown in the following figure.
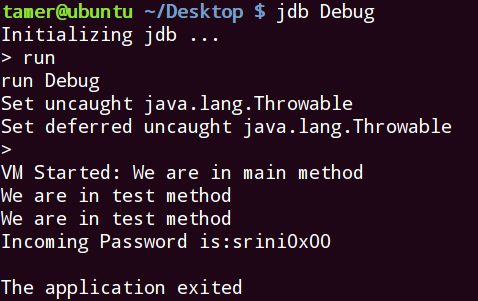
The above figure shows that JVM has been started and the program has finished executing and the application exited. To stop the flow and manually execute each line, we need to set break points before running the application.
We can set breakpoints at the beginning of a method using a "stop in" command. We can do this as shown in the following figure.

We can see that we have set up a break point in the method main which is in the class Debug. Type of parameters is also specified.
Let's now start JVM and run the program to hit the break point. We use the "run" command as shown earlier.
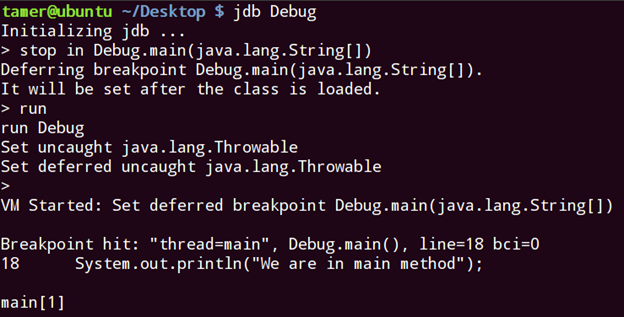
As expected, breakpoint is hit, and JDB is also showing the next line to be executed, which is:
System.out.println("We are in main method");
To look at the source code around the current location, we can execute the command "list" as shown below.
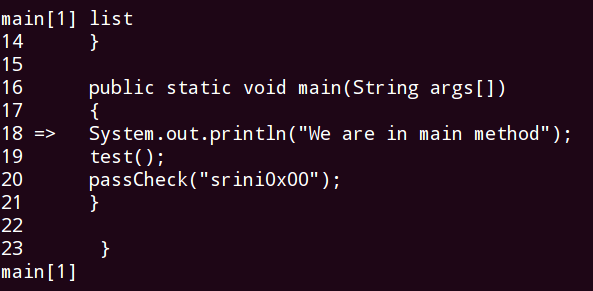
To see all the breakpoints set, we can use the command "clear" as shown below.

As we set, it is showing the place where we set the breakpoint.
To see all the thread groups, we can run the command threadgoups.

As we can see, there are two thread groups available: "system" and "main".
We can see all the thread, by running the command "threads" as shown below.

If you observe the above figure, we have three threads in the system thread group and one thread with the name "main" in the main thread group in the running state. This is what we are going to debug in this article.
We can see the information about all the classes loaded in JVM using the "classes" command as shown below.
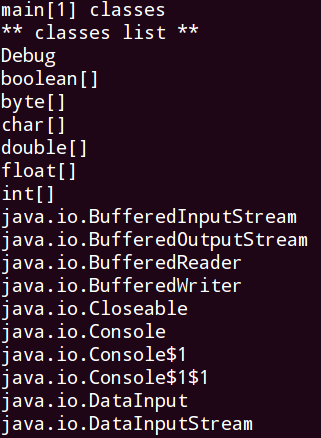
The above figure shows all the classes loaded in JVM currently (the output is truncated to save space).
To see more information about a particular class, we can use the following command.
class <classname>
The below screenshot shows specific details of our current class "Debug".

Similarly, we can see the information about any class. As an example, let's inspect java.io.DataInputStream. The output looks as shown below.

To see the list of methods loaded, we can use the command "methods <classname>" as shown below.
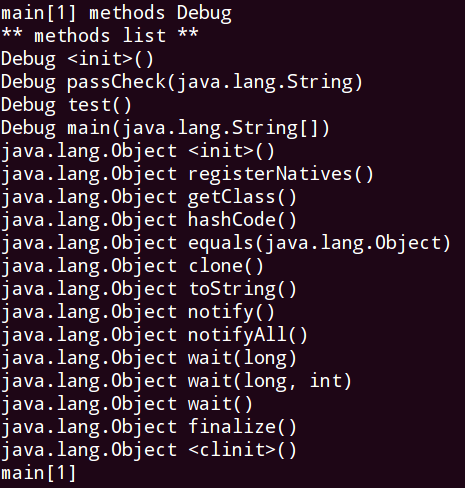
The above mentioned commands are a few important commands that one may need. Now, let's start looking at the flow of the program and see how JDB can help us in debugging the application.
To execute the next line, which is System.out.println("We are in main method"); we can type the command "next".

As expected, the execution is completed and JDB is showing the next line to be executed, which is a call to the method "test".
Here, if we give the "next" command, it will finish executing the definition, and control comes back to the next line, which is called the "passCheck" method in our case. This is shown in the figure below.

As explained, it has finished executing the definition of the test method aisnd now waiting to execute the next line passCheck("srini0x00);
Now, if we want to get into the method definition and control the flow inside the definition, we should run the command "step" rather than "next".
I have restarted my program and am now giving "stethep" command at the same line as shown in the figure.

Now, we can run the "next" command to continue to the next line as shown below.

At this point, for some reason if we want to get out of the method definition, rather than executing the rest of the lines inside the definition, we can run the command "step up" as shown below.

As expected, it has exited from the definition and control is now in the main method waiting to execute the next line.
The next couple of lines are going to be interesting, as we are going to see the commands to view the secret messages stored in variables. Before going there, I would like to explain one more interesting command called "where".
The "where" command shows the current call stack. So, let's run it inside the main method and see the current call stack. Later let's run the same command inside a method definition to understand its functionality.

As we can see, we are currently inside the method Debug.main.
Let's now, give a "step" command and get into the method definition and check the current call stack inside the method. This is shown in the following figures.


The above figure shows the current location as "Debug.passCheck" and it is called from "Debug.main".
Now, we are inside the passCheck method. So, let's see if there are any interesting local variables holding some sensitive information. We can see all the local variables using the command "locals". (This doesn't work if the code is not compiled using "-g" option).
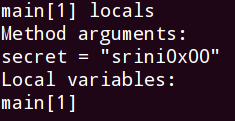
As we can see, the call has sent a password to the method definition as an argument and it is displayed. The above figure is showing only method arguments, since they are not yet assigned to the local variable declared inside the definition yet. We can execute the next line and see the value of the local variable "password".
We can use the print command to print the value of a specific variable as shown below.

Conclusion
This article has explained the basics of JDB, various JDB commands and how to apply them for debugging Java applications. It has also provided the necessary information to understand the next article in the series.
References
Become a Certified Ethical Hacker, guaranteed!
Get training from anywhere to earn your Certified Ethical Hacker (CEH) Certification — backed with an Exam Pass Guarantee.
http://docs.oracle.com/javase/7/docs/technotes/tools/windows/jdb.html


