Introduction to SoftICE
It's often the case that we need to debug a kernel application, like device driverS, system calls, interrupt routines, or some other kernel application. In this article we'll talk about SoftICE kernel debugger.
Installing and configuring the SoftICE debugger

Intro to x86 Disassembly
We need to download the SoftICE, presumably the trial version from the Internet. Upon doing that and completing the installation, the configuration dialog will be presented to us where we can control various options of SoftICE. On the picture below we can see how SoftICE is started; by default, the Manual option is selected, which specifies that we must start SoftICE manually each time that we need it. There are also other options that we can select from. If we use the Boot option, SoftICE will be loaded before Windows loads, which will give us the chance to debug device drivers. There are also other options that can be seen on the picture below:
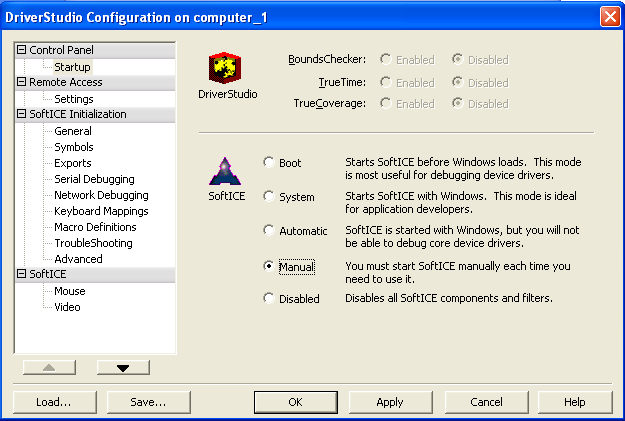
The important thing we must do in the configuration settings is check the Video support. We must click on the Video option that can be seen on the picture above (on the left side) where "Universal Video Driver" is selected by default, which is ok. We can see the options presented on the picture below:
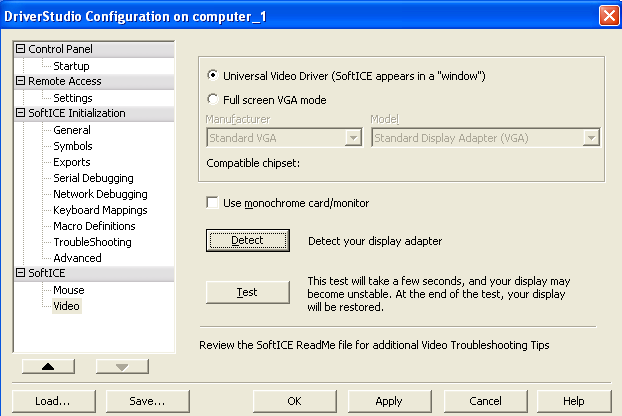
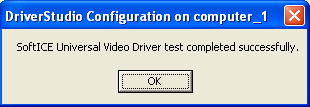
We must click on the Detect button to detect our video adapter followed by clicking on the Test button to test if everything is ok. If all the tests succeed, the following pop-up button will be displayed:
After that, we can save all the changes we've made, finish the installation and restart our computer (in our case the virtual machine running Windows XP SP3). After rebooting, let's take a look at the configuration file that's located under C:WINDOWSsystem32drivers directory:

The default configuration is presented below:
[plain]PENTIUM=ON
NMI=ON
ECHOKEYS=OFF
NOLEDS=OFF
NOPAGE=OFF
SIWVIDRANGE=ON
THREADP=ON
LOWERCASE=OFF
SYM=512
HST=256
MACROS=32
DRAWSIZE=2048
INIT="wl; color f a 4f 1f e; code on; lines 60; wc 32; wd 4; wr; faults off; "
INIT="ww 4;dex 1 ss:esp;altkey ctrl d;watch es:di;watch eax;watch *es:di;set mouse 3;cls;X;"
F1="h;"
F2="^wr;"
F3="^src;"
F4="^rs;"
F5="^x;"
F6="^ec;"
F7="^here;"
F8="^t;"
F9="^bpx;"
F10="^p;"
F11="^G @SS:ESP;"
F12="^p ret;"
SF3="^format;"
AF1="^wr;"
AF2="^wd;"
AF3="^wc;"
AF4="^ww;"
AF5="CLS;"
AF11="^dd dataaddr->0;"
AF12="^dd dataaddr->4;"
CF1="altscr off; lines 60; wc 32; wd 8;"
CF2="^wr;^wd;^wc;"
MENU=Copy , NMPD_COPY , 0
MENU=Paste , NMPD_PASTE , 0
MENU=Copy&Paste , NMPD_COPYANDPASTE , 0
MENU=Display , NMPD_DISPLAY , 0
MENU=Un-Assemble , NMPD_UNASSEMBLE , 0
MENU=What , NMPD_WHAT , 0
MENU=Prev , NMPD_PREV , 0
MENU=Reip , r eip %cp% , 0
MENU=Add Watch , watch %cp% , 0
MENU=Break On Text , bpx %cp% , 0
NETSUPPORT=OFF
; WINICE.DAT
; (SystemRootSystem32DriversWINICE.DAT)
; for use with SoftICE for Windows NT (versions 3.0 and greater)
;
; ***** Examples of export symbols that can be included *****
; Change the path to the appropriate drive and directory
EXP=SystemRootSystem32hal.dll
EXP=SystemRootSystem32ntoskrnl.exe
EXP=SystemRootSystem32ntdll.dll
EXP=SystemRootSystem32kernel32.dll
EXP=SystemRootSystem32user32.dll
EXP=SystemRootSystem32csrsrv.dll
EXP=SystemRootSystem32basesrv.dll
EXP=SystemRootSystem32winsrv.dll
[/plain]
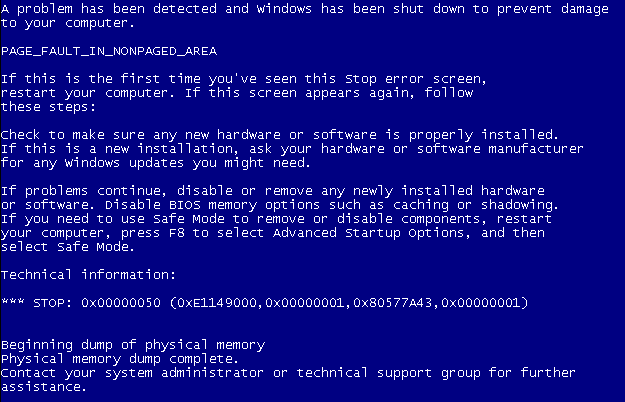
Upon rebooting the Windows system and pressing the Ctrl-D shortcut to start the SoftICE debugger, my system froze and the blue screen error message, like shown on the picture below, was presented.
After downloading the full SoftICE package, the archive has enclosed instructions on how to install SoftICE. Basically, we have to do the same things as above, but once it's installed, the configuration window has a little more options, as we can see below:
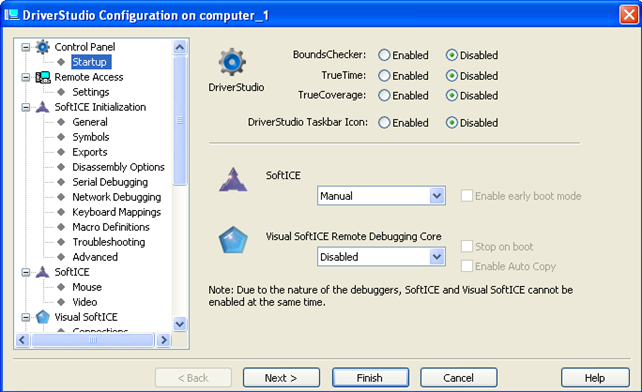
Basically we must still click on the Video option and configure the video settings as already described. Additionally, we must disable DEP by editing the C:boot.ini configuration file and adding the 'alwaysoff' value option:
[plain]
/noexecute=alwaysoff
[/plain]
We can do that by right-clicking on "My Computer" and selecting Preferences. Then we click on the "Advanced" tab and under "Startup and Recovery", pressing on the Settings tab.
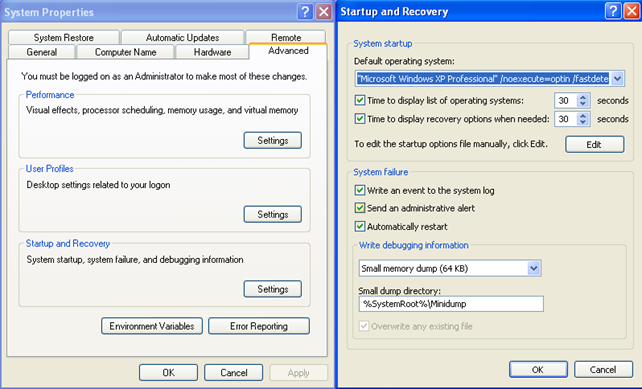
Sometimes we must also configure the .vmx file and add the following configuration options:
[plain]
svga.maxFullscreenRefreshTick = 5
vmmouse.present = "FALSE"
[/plain]
Now we've done everything needed for installing the SoftICE on Windows XP virtual machine.
Starting the SoftICE debugger
To start SoftICE debugger we need to click on the "Start SoftICE" option that's accessible under the All Programs options, as can seen on the picture below:
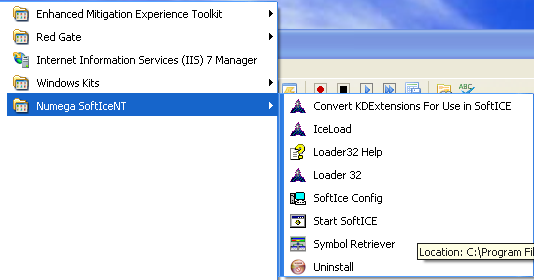
We can immediately see that this is only a batch script (because of the icon). So if we right-click on that option and click on Edit, we'll be presented with the script code that is run after clicking on it. We can see that on the picture below:

When clicking on "Start SoftICE", the "net start ntice" command is being run, so the SoftICE debugger was installed as a service that we must start whenever we want to start the SoftICE debugger. Since we're only starting the service, let's do it from the command prompt. Below we can see that the NTice service was started successfully:

After that we can start interacting with SoftICE with its default shortcuts. If we would like to show the debugging screen, we need to press the Ctrl-D shortcut. If we press the Ctrl-D again, we'll hide the SoftIce and get the control back; this means that SoftICE is running fine behind the scenes.
When pressing the Ctrl-D, a SoftICE window should appear. as we can see on the picture below:
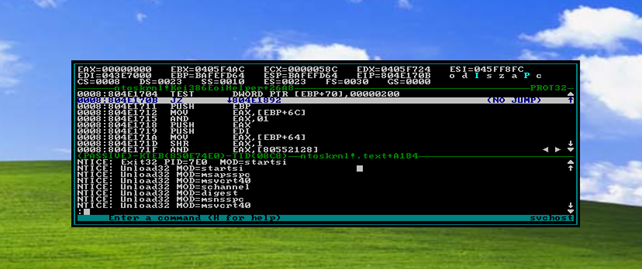
SoftICE commands
If we enter the :help command into SoftICE, we should receive all the commands SoftICE supports. All the commands are presented on the four pictures below. This is being done because it's rather hard to get all the commands out of the SoftICE quickly. Now you can just open up the tutorial and check out the command you're interested in.
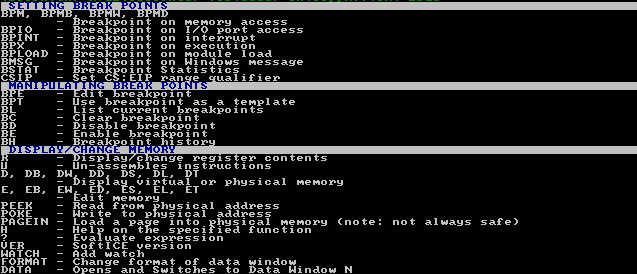
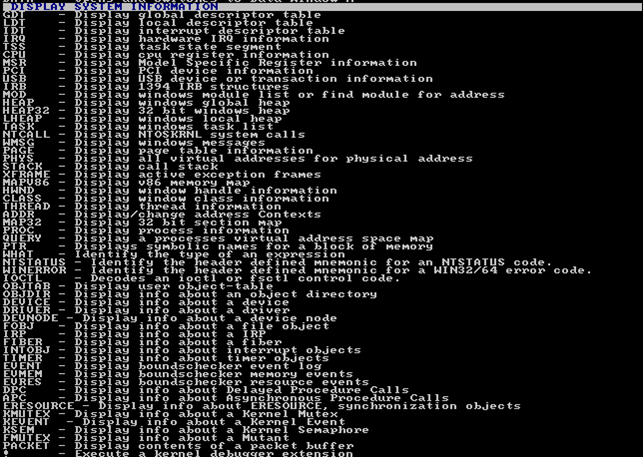
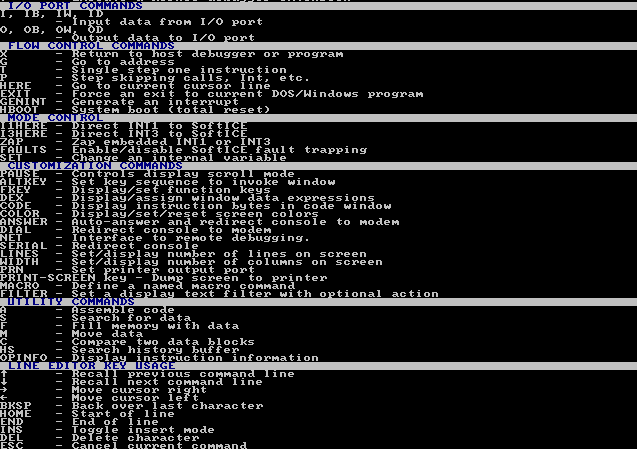
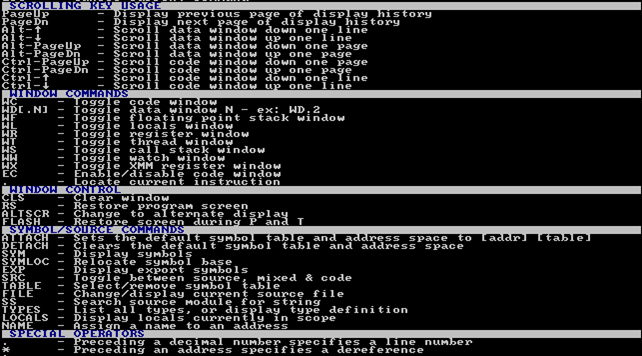
If we input the command "help <command>", we'll get help about the specific command. This can be useful if we don't know the exact command syntax and we would like to find out. We can use the proc command to display all processes that we can debug. We can also use the driver command to display all the drivers that we can debug.
Let's also present some other important commands:
- addr: enters address space of some process, which is needed because the CPU doesn't know anything about processes.
- d: display the values at some virtual memory address.
- e: edit the value at some virtual memory address.
- u: disassemble instructions at some virtual memory address.
- a: assemble instructions at some virtual memory address.
- r: display/edit the contents of registers.
- S: search for data in memory.
- bpx: breakpoint on execution.
- bpm: breapoint on memory access.
- bpint: breakpoint on interrupt.
- bmsg: breakpoint on Windows message.
- bl: display current breakpoints.
- bc: clear breakpoint.
- bd: disable breakpoint.
- be: enable breakpoint.
- t: single step one instruction.
- p: execute until return.
- wmsg: display window messages.
- hwnd: display window handle information.
- exp: display export symbols.
- wr: show/hide register window
- wd: show/hide data window
- wc: show/hide code window
SoftICE example
Ok, so far we've presented the basic information about installing and configuring SoftICE and its basic commands, but what can we really do with it. We've already presented the SoftICE basic window when starting it, but let's present it again:
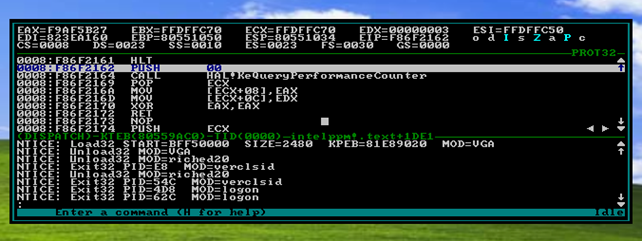
On the picture above, we can see multiple parts that constitute a window. At the top of the SoftICE window, we can see all the registers. Then we can see a disassembly listing and the command window. And in the line at the bottom of the window where is says "Enter a command", we can see the current process being debugged. Currently it says Idle, because we're not debugging any process.
First, we can enter the command proc to check out the processes that we can debug. The picture below presents how we can enter the command into SoftICE just before executing it:
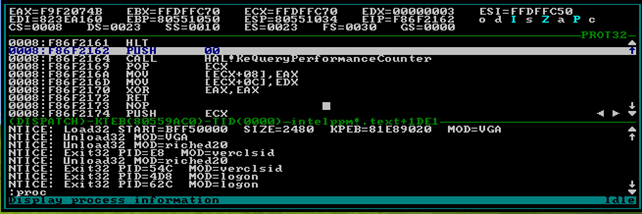
Notice the :proc command at the bottom of the SoftICE window. After pressing enter, the command will be executed and all the processes will be shown, as seen below:

We can see that there's not much room for the data to be displayed. We can adjust that by entering the following command:
[plain]
width 90
lines 80
ww 2
wd 15
wc 50
[/plain]
If we execute the :proc command again, all the processes will be displayed as can be seen on the picture below:

We can see all the processes displayed, which we can verify with opening the Task Manager and checking whether the same processes are displayed:
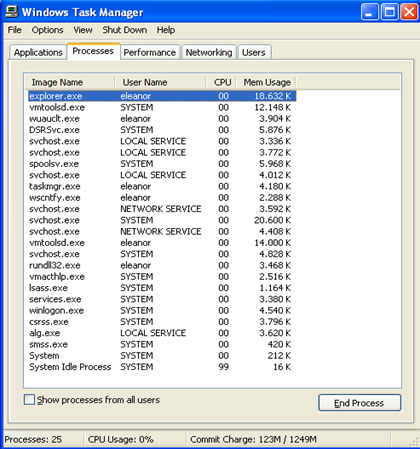
What's interesting is that when entering the :proc command all the processes are displayed, but with quite a lot of information. Each line displays the process name, process ID (PID), process threads, status, etc… Let's start by entering the address space of the explorer process by executing the "addr explorer" command, as seen on the picture below:

Notice that on the right side of the status line we can see the text explorer, which means that we're currently debugging the explorer process. If we would like to display all the sections of the explorer process, we can do that with the maps32 command, as seen on the picture below:

The explorer process has .text, .data, .rsrc and .reloc sections. We can also see their addresses, sizes, types and the access permissions on the picture above.
Let's now write a very simple program, which the source code can be seen below. The source code is written in C++ and compiled in Visual Studio:
[cpp]#include "stdafx.h"
#include <stdio.h>
int _tmain(int argc, _TCHAR* argv[])
{
printf("Hello World!n");
/* wait */
getchar();
}
[/cpp]
Once the program is compiled and executed, it should print "Hello World!" to the console window, like it can be seen on the picture below:

After the program runs, it prints the message to the console window and then waits for the key to be pressed. This happens because of the getchar() function that we've used so that the program doesn't print the message and terminates but waits before termination. On the picture below we can see that we've already run the program hello and that we're currently debugging it (notice the '*' besides the program name and also the 'hello' string in the status bar):

Let's display all the segments the hello program has with the map32 command:

If we execute the ":u eip" command, we'll be displaying the assembly instruction of where the EIP points to. We can see that on the picture below; previously the command hlt was executed, which stops program execution and places the processor in a HALT state until the key is pressed.

Let's now search for the string "Hello World" in the executable. On the picture below, we can see that we first printed the help of the search command and later inputted the search command that searches for the "Hello World" string, which is found at address 0x0012C028.

If we now execute the "d 0012C028" command, we'll dump the memory at that address, which can be seen on the picture below:

Notice that the first string presented above is the "Hello World!" We've just successfully dumped the memory and confirmed that the string is actually located there.
Now let's add a breakpoint, which will be set on the memory location where our "Hello World!" string is saved. To do that, we must use the bpm command. On the picture below, we're first presenting the help of the bpm command, then setting the breakpoint and listing all the breakpoints that are set for the current program.

The breakpoint will not be hit whenever we will try to access or write to the location 0x0012C028.
Conclusion
We've seen the SoftICE installation, configuration and basic usage. We've also taken a look at the simple program and interacted with it with the SoftICE debugger. This was just a basic introduction and not a complete reference to SoftICE.

Learn ICS/SCADA Security Fundamentals


