Extending Debuggers

Sometimes we come across situations when we are in need of doing something inside our debuggers or to extend the functionality of them. For such things, debuggers usually provide an API interface to extend or provide extra functionality for the debugger.
There are two types of API provided by the debuggers:

Become a certified reverse engineer!
1: SDK API
One can choose any based on the requirements. Usually when there is a rapid requirement, scripting will come in handy, but if something requires system or low level access, then SDK is useful. SDK API requires being compiled, while scripts can be modified easily.
Ollydbg Plugin Interface
Ollydbg supports API for plugins. Plugins are compiled DLL written in C programming language. The following constants define particular actions in a debugger context.
[c]
#define ODBG_Plugindata _ODBG_Plugindata
#define ODBG_Plugininit _ODBG_Plugininit
#define ODBG_Pluginmainloop _ODBG_Pluginmainloop
#define ODBG_Pluginsaveudd _ODBG_Pluginsaveudd
#define ODBG_Pluginuddrecord _ODBG_Pluginuddrecord
#define ODBG_Pluginmenu _ODBG_Pluginmenu
#define ODBG_Pluginaction _ODBG_Pluginaction
#define ODBG_Pluginshortcut _ODBG_Pluginshortcut
#define ODBG_Pluginreset _ODBG_Pluginreset
#define ODBG_Pluginclose _ODBG_Pluginclose
#define ODBG_Plugindestroy _ODBG_Plugindestroy
#define ODBG_Paused _ODBG_Paused
#define ODBG_Pausedex _ODBG_Pausedex
#define ODBG_Plugincmd _ODBG_Plugincmd
Plugins for ollybdg are written as shared library in C. We need to define the dll enrty point and inilitize the plug in before it is used. Events are also defined using exports.
Plugins are initialized using the ODBG_Plugininit() export function.
[c]
/******************************************************
* Sample Ollgdbg Plugin file
*
#include <stdio.h>
#include <plugin.h>
#pragma once
#pramga Comment ("lib", "ollydbg.lib") // Inlude the library file
BOOL WINAPI DllEntryPoint(HINSTANCE hi,DWORD reason,LPVOID reserved) {
if (reason==DLL_PROCESS_ATTACH)
hinst=hi; // Mark plugin instance
return 1; // Report success
extc int _export cdecl ODBG_Plugininit()
{
}
extc void _export cdecl ODBG_Pluginmainloop(DEBUG_EVENT *debugevent) {
};
extc void _export cdecl ODBG_Pluginaction(int origin,int action,void *item) {
t_bookmark mark,*pb;
t_dump *pd;
if (origin==PM_MAIN) {
switch (action) {
break;
case 1:
MessageBox(NULL, "Hello World", "Hello World! Plugin ", MB_OK);
default: break;
}; }
}
Immunity Scripting
Immunity debugger also supports scripting based on Python programming language. The scripts written for immunity debugger are known as pycommands. They can be executed in the command bar as !.
Immunity scripting supports breakpoints, hooking, and loggers.
The default skeleton for a pycommands script is:
[c]
# !usr/bin/python
import immlib
def main(args):
dbg = immlib.Debugger()
return ""
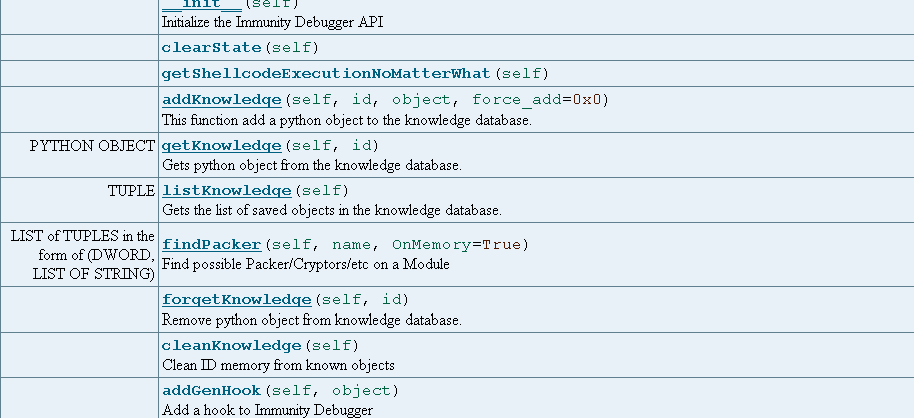
dbg = immlib.Debugger() – define a instance to a debugger class
The following are some of the basic functions inside the Debugger class:
The script's main body is located in the main function with arguments as args. To execute the script, we need to place the file in the "C:Program FilesImmunity IncImmunity DebuggerPyCommands" directory and execute from the immunity command bar as !filename
Let's now create a dummy hello world script that writes to the log window:
[c]
import immlib
def main(args):
dbg = immlib.Debugger()
dbg.writeLog(“Hello world!”)
return ""
We can save this file in the "C:Program FilesImmunity IncImmunity DebuggerPyCommands" as helloworld.py and it can be executed using the following command: !helloworld

There are more functions inside Debugger() class, let's try to explore and use them.
Getting the PEB address
getPEBAddress() is a method inside the Debugger class that can be used to get the PEB address of the loaded application inside the debugger.
We can use the PEB address to patch many things. PEB is mainly used for thread related structures and processing information. We can get the details in Loaded modules, for example what this malware code does with PEB:
[c]
typedef struct _PEB {
BYTE Reserved1[2];
BYTE BeingDebugged;
BYTE Reserved2[1];
PVOID Reserved3[2];
PPEB_LDR_DATA Ldr;
PRTL_USER_PROCESS_PARAMETERS ProcessParameters;
BYTE Reserved4[104];
PVOID Reserved5[52];
PPS_POST_PROCESS_INIT_ROUTINE PostProcessInitRoutine;
BYTE Reserved6[128];
PVOID Reserved7[1];
ULONG SessionId;
v9 = *(_DWORD *)"LoadLibraryExA";
v10 = *(_DWORD *)&aLoadlibraryexa[4];
v11 = *(_DWORD *)&aLoadlibraryexa[8];
v12 = *(_WORD *)&aLoadlibraryexa[12];
v13 = aLoadlibraryexa[14];
v15 = sub_4001E92();
v20 = 0;
v16 = (int (__thiscall *)(int, int, int *))sub_4001EA7(v15, "GetProcAddress");
v20 = v16(v5, v15, &v9);
v3 = a1;
result = *(_DWORD *)(a1 + 60);
for ( i = a1 + *(_DWORD *)(result + a1 + 128); *(_DWORD *)(i + 4) || *(_DWORD *)(i + 12); i += 20 )
{
v7 = v3 + *(_DWORD *)i;
for ( j = v3 + *(_DWORD *)(i + 16); ; j += 4 )
{
result = *(_DWORD *)v7;
if ( !*(_DWORD *)v7 )
break;
v15 = -1;
if ( result < 0 )
{
v2 = (unsigned __int16)result;
v15 = (unsigned __int16)result;
}
v14 = v3 + result;
v8 = *(_DWORD *)(i + 12);
v17 = v3 + v8;
v19 = ((int (__fastcall *)(int, int, int, _DWORD, _DWORD))v20)(v3, v2, v3 + v8, 0, 0);
if ( v15 == -1 )
{
v17 = v14 + 2;
v18 = ((int (__stdcall *)(int, int))v16)(v19, v14 + 2);
}
else
{
v17 = v15;
v18 = ((int (__stdcall *)(int, int))v16)(v19, v15);
}
if ( *(_DWORD *)j != v18 )
*(_DWORD *)j = v18;
v3 = a1;
v7 += 4;
}
}
return result;
}
This code snippet loads LEP loaded modules and parses the IAT.
Now let's try to try to write a call counter in pycommands.
[c]
import immlib
times = "
class instructionHook(LogBpHook):
def __init__(self):
LogBpHook.__init__(self)
return
def run(self, regs):
global times
imm = immlib.Debugger()
imm.log("instruction Executed %d" % times)
times = times + 1
def main(args):
memlocation = 0x401029
logbp = instructionHook()
funcName = dbg.getFunction(imemlocation).getName()
return "Hooks Placed"
[/c]
Become a certified reverse engineer!
Would you like to test your skills further with a CTF challenge? Check this out:


- Exam Pass Guarantee
- Live expert instruction
- Hands-on labs
- CREA exam voucher
In this series
- Extending Debuggers
- CompTIA CySA+ Salary: What to expect in 2025
- How to become a cybercrime investigator
- CEH version comparison: V12 to V13 evolution guide
- SecurityX (CASP+) certification: Overview and career path [2025 update]
- Network+ certification: Overview and career path [2025 update]
- ISC2 CSSLP certification overview: What you need to know
- ISC2 CGRC: Overview & career path
- CRISC certification: Overview & career path [updated 2021]
- PMP certification: Overview and career path [updated 2021]
- ISACA CDPSE certification: Overview of the new ISACA privacy certification
- CGEIT certification: Overview and career path [updated 2021]
- What is a cyber range?
- Microsoft azure certification: Overview And career path
- CEH salary guide: What Certified Ethical Hackers really earn
- Average SecurityX (CASP+) salary [2025 update]
- CompTIA Network+ certification — A 2025 salary analysis
- CompTIA CySA+ exam (CSO-003): Your guide
- CCSP salary: How much can you make as a cloud security professional?
- Average Security+ salary (2025): Your guide to a prosperous cybersecurity career
- Average CGRC (Certified in Governance, Risk and Compliance) salary
- CRISC Frequently Asked Questions (FAQ) [updated 2022]
- Average CSSLP Salary in 2021
- ISACA CDPSE exam details and process
- How To Become CGEIT Certified – Certification Requirements [updated 2021]
- How to pick the best cyber range for your cybersecurity training needs and budget
- CEH exam eligibility: Application process & requirements guide
- SecurityX (CASP+) frequently asked questions (FAQ) [2025 update]
- CISSP domains overview: Your complete preparation guide
- CCSP exam and CBK changes in August 2024
- Comprehensive guide to CompTIA Security+ domains (2025)
- Average CRISC Salary [2023 update]
- CGRC certification job titles and career outlook
- ISC2 CSSLP exam details and process
- ISACA CDPSE certification exam: Overview of domains
- An Introduction to the PMP: Exam Details and Process [updated 2021]
- CGEIT certification exam: overview of domains [Updated 2021]
- 10 Success Tips: How to Pass Your Certified Ethical Hacker (CEH) Exam
- Network+: Exam details and process [2025 update]
- SecurityX (CASP+): Exam details and process [2025 update]
- How to become CCSP certified: Certification requirements
- Certified in Risk & Information Systems Control (CRISC) Exam Overview [updated 2022]
- ISC2 CGRC exam details and process
- Best CSSLP study resources and training materials
- ISACA CDPSE domain 1: Privacy governance
- 10 Tips for PMP Certification Exam Success [updated 2021]
- CGEIT certification exam details and process [updated 2021]
- Certified Ethical Hacker (CEH) study guides & resources [updated 2025]
- CompTIA SecurityX resources: Videos, books, tests and more!
- How to get the CompTIA Network+ certification: Requirements and step-by-step instructions [2025 update]
- CySA+ exam objectives: The 4 domains that will be covered
Get certified and advance your career!
- Exam Pass Guarantee
- Live instruction
- CompTIA, ISACA, ISC2, Cisco, Microsoft and more!
CompTIA CySA+
Discover the latest salary trends for CompTIA CySA+ certified professionals in 2024. Learn what factors influence your earning potential in the cybersecurity field.

Cybercrime investigator
Cybercrime has hit record levels, with an expected $7 trillion USD to be made from cybercriminal activity by 2021. Investigating these sorts of crimes can be

EC-Council CEH
CEH v13 is the world's first AI-powered ethical hacking certification. Discover what's new, how it compares to v12/v11 and why it's a career game-changer.

CompTIA SecurityX
Explore the expert-level CompTIA SecurityX certification, what to expect on the exam, the career benefits and more.
