A Guide to Debugging Android Binaries
In this paper, I'll describe how to start reverse code engineering in Android devices. In this tutorial, you'll learn:
- Installation & configuration of Android Virtual Device.
- How to build your debugging environment.
- Short ARM assembly description.
- Debugging with GDB inside your Android device.
- Remote Debugging using gdbserver.
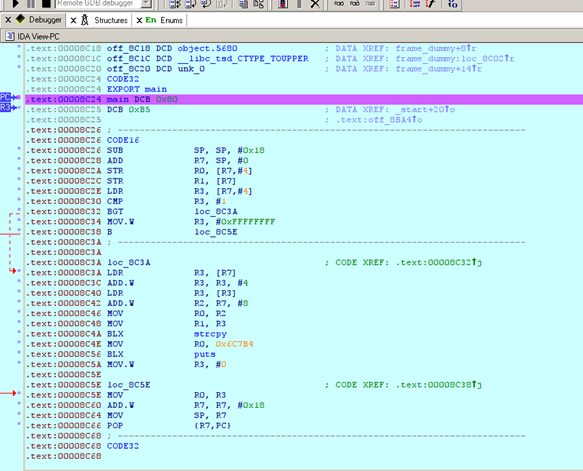
- Remote debugging using IDA.
1. Installation & configuration of Android Virtual Device
The first thing to do is to download Android SDK and NDK. We will use GDB, other binutils, and also GCC and LD cross compiling chains. The cross compilers are able to compile binaries for other architectures. In our case, we want to compile ARM binaries from x64 architecture, since we are working on Linux x86_64, and we want to compile binaries for ARM android, so we have to use them.
If you are curious about how to build these cross compiling chain tools,here are the commands:
# wget -c ftp://ftp.gnu.org/gnu/binutils/binutils-2.11.2.tar.gz
# tar xvf binutils-2.11.2.tar.gz
# cd binutils-2.11.2
In our case, we don't need to do this, as NDK contains all the things we need. Let's go back and download Android SDK and Android NDK from here:
# https://developer.android.com/tools/sdk/ndk/index.html
# https://developer.android.com/sdk/index.html
or we can download the pre-compiled arm-linux-gnueab- toolchain .
tarball these file in /opt/ and then add its path in $PATH variable environment.
After that we have to install and configure an Android Virtual Device (AVD).This is where our binaries will run.
Type :
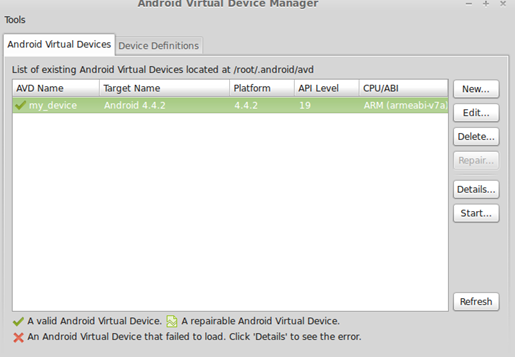
# android avd
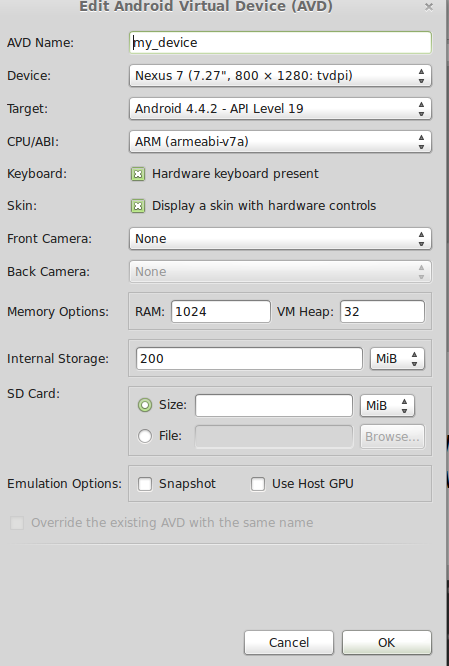
Click to New :


Click OK, then start your Virtual Device. However, we don't need its grapical user interface, we will connect to it using shell. AVD gives as a rooted device, so we can do everything, which will be great when we debug Linux internals and keep tracking syscalls.
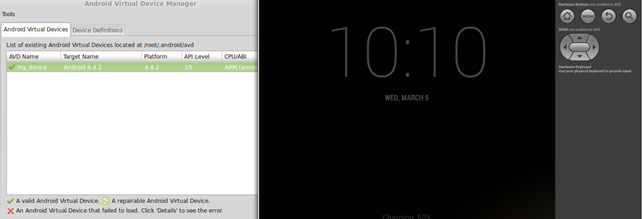
Once you click on the start button, your Virtual Device appears like this:

In my case, I used Android 4.2 as a target and Nexus 7 as device,though there is nothing wrong with using other targets or devices.
Let's run our device shell:
[plain]
$ adb shell
# id
uid=0(root) gid=0(root)
2.How to build your debugging environment
Nothing's new here, just mentionning that we will show three ways to debug an Android binary. The first one is to put GDB inside the device and start debugging as you are on a Linux box, thus we can keep track of several things like symbols, GOT, linked libraries, etc.
The second one is by using gdbserver and opening a port in the device and forwarding it to an external port to gain access into the device using a GDB client.
The third is debugging with IDA Pro.
Debugging Android binaries without understanding ARM Assembly is worthless. We will show in the next chapter some basic stuff in ARM Assembly.
3.Short ARM description
Personally, I like ARM assembly because it's very easy to learn and dive into its programming. We will show some basic instructions and conventions:
3.1.Registers
ARM Assembly has 16 registers. Some of them are for function arguments, others for local variables, program counter, stack pointer, and other registers.
R0 to R3 : for function arguments. Alternative names are a0-a3.
R4 to R9 : for local variables.
R7 : almost holds the syscall number.
R10 (sl) : Stack Limit.
R11 (fp) : Fame Pointer.
R12 (ip) : Intra Procedure.
R13 (sp) : used as Stack Pointer like RSP in x86_64.
R14 (lr) : Link Register.
3.2.Branching
Branching instructions are used when the program needs some loops, procedures and functions. The behaviour of the calling function in ARM is different from x86 assembly .
Here are the basic branching instructions:
B Branch
BL Branch with Link
BX Branch with Exchange
The B (Branch) doesn't affect LR. That means if we jump to a subroutine we don't have any traceback for where we were. It's like JMP instruction in x86 assembly.
The BL (Branch with Link) instruction makes a subroutine call by storing PC-4 in LR of the current place, and to return from subroutine, we simply need to restore PC from LR like: mov pc,lr.
BX and BLX instructions are used in THUMB MODE which we don't dive into in this part.
3.3.Data Processing
As we know, ARM is a LOAD/STORE architecture it contains 4 main instructions classes:
- Arithmetic operations:
ADD op1+op2
ADC op1+op2+carry
SUB op1-op2+carry-1
examples :
ADD r0,r1,r2
SUB R1,R2,#1
- Comparison:
CMP op1-op2
TST op1 & op2
By the way, the results of these operations are not written.
Syntax : <operation> {<cond>} Rn,Op
examples :
CMP R0,R1
CMP R0,#2
- Logical operations:
AND op1,op2
EOR op1,op2
- Data movement between registers:
MOV op1,op2
syntax : <Operation>{<cond>}{S} Rn, Op2
Examples:
MOV r0, r1
We have shown some basic ARM instructions and as we said, it is easy to learn by practicing with some small examples.
4.Debugging with GDB inside your Android device
You should download GDB ARM version statically linked. After we have GDB for arm targets, we have to push it on the Android device.
# adb push ~/Bureau/arm-gdb /data
So we make a small ARM binary as an example inside the device and we'll keep track of its behaviour:
[c]
#include <stdio.h>
int main(int argc,char **argv)
{
char buf[16];
if(argc < 2)
strcpy(buf,argv[1]);
printf("Hello : %s n",buf);
return 0;
}
Let's compile it:
# arm-linux-gnueabi-gcc -o s s.c -static -zexecstack -fno-stack-protector
# adb shell
WARNING: generic atexit() called from legacy shared library
Reading symbols from /data/s...(no debugging symbols found)...done.
[c]
(gdb) disas main
Dump of assembler code for function main:
0x00008c24 <+0>: push {r7, lr}
0x00008c26 <+2>: sub sp, #24
0x00008c28 <+4>: add r7, sp, #0
0x00008c2a <+6>: str r0, [r7, #4]
0x00008c2c <+8>: str r1, [r7, #0]
0x00008c2e <+10>: ldr r3, [r7, #4]
0x00008c30 <+12>: cmp r3, #1
0x00008c32 <+14>: bgt.n 0x8c3a <main+22>
0x00008c34 <+16>: mov.w r3, #4294967295
0x00008c38 <+20>: b.n 0x8c5e <main+58>
0x00008c3a <+22>: ldr r3, [r7, #0]
0x00008c3c <+24>: add.w r3, r3, #4
0x00008c40 <+28>: ldr r3, [r3, #0]
0x00008c42 <+30>: add.w r2, r7, #8
0x00008c46 <+34>: mov r0, r2
0x00008c48 <+36>: mov r1, r3
0x00008c4a <+38>: blx 0x12e00 <strcpy>
0x00008c4e <+42>: movw r0, #51124 ; 0xc7b4
0x00008c52 <+46>: movt r0, #6
0x00008c56 <+50>: blx 0x99a8 <puts>
0x00008c5a <+54>: mov.w r3, #0
0x00008c5e <+58>: mov r0, r3
0x00008c60 <+60>: add.w r7, r7, #24
0x00008c64 <+64>: mov sp, r7
0x00008c66 <+66>: pop {r7, pc}
End of assembler dump.
(gdb) r aaaaaaaaaaaaaaaaaaaaaaaaaaaaaaaaaaa
Starting program: /data/s aaaaaaaaaaaaaaaaaaaaaaaaaaaaaaaaaaa
Program received signal SIGSEGV, Segmentation fault.
0x61616160 in ?? ()
5.Remote debugging using gdbserver
This is another cool way to debug outside your device , so we copy gdbserver into /data directory or whatever you want. In the latest Android version, gdbserver has been included by default. Next, you choose between either attaching to a running process or executing a new process.
The first thing we should do is port forwarding:
[c]
adb forward tcp:<PC port> tcp:<device port>.
Example:
[c]
# adb forward tcp:1234 tcp:1234
# adb shell
We choose any running process:
[c]
root@generic:/ # gdbserver :1234 --attach 1436
Attached; pid = 1436
Listening on port 1234
Remote debugging from host 127.0.0.1
In our box we use:
[c]
# cd /android-ndk-r9/toolchains/arm-linux-androideabi-4.8/prebuilt/linux-x86_64/bin # ./arm-linux-androideabi-gdb
GNU gdb (GDB) 7.3.1-gg2
Copyright (C) 2011 Free Software Foundation, Inc.
License GPLv3+: GNU GPL version 3 or later <http://gnu.org/licenses/gpl.html>
This is free software: you are free to change and redistribute it.
There is NO WARRANTY, to the extent permitted by law. Type "show copying"
and "show warranty" for details.
This GDB was configured as "--host=x86_64-linux-gnu --target=arm-linux-android".
For bug reporting instructions, please see:
<http://source.android.com/source/report-bugs.html>.
(gdb) target remote :1234
Remote debugging using :1234
Remote communication error. Target disconnected.: Connection reset by peer.
(gdb)
(gdb) target remote :1234
Remote debugging using :1234
0xb6eb1f9c in ?? ()
(gdb) x/10i $pc
Cannot access memory at address 0x5b6
=> 0xb6eb1f9c: svc 0x00000000
0xb6eb1fa0: mov r7, r12
0xb6eb1fa4: cmn r0, #4096 ; 0x1000
0xb6eb1fa8: bxls lr
0xb6eb1fac: rsb r0, r0, #0
0xb6eb1fb0: b 0xb6ecdb28
0xb6eb1fb4: mov r12, r7
0xb6eb1fb8: mov r7, #174 ; 0xae
0xb6eb1fbc: svc 0x00000000
0xb6eb1fc0: mov r7, r12
(gdb)
6. Remote debugging using IDA Pro:
This is like gdbserver, but we should push android_server in the device machine.
[c]
# adb push android_server /data
In IDA go to Debbugger → Remote ARMLinux / Android server debugger, and set the host and the port with the path of the application.


Become a certified reverse engineer!
That's all, we have described all the techniques. Moreover, I made this tutorial practical and as a reference for those of you who are interested.


