IDA: Jumping, searching and comments
In this tutorial, we will describe the Jump Menu option in Ida Pro. Using the Jump command when analyzing an executable can prove to be a valuable trick in performing an analysis quickly and efficiently. We often need to jump to a specific location in the executable. Let's first present the Jump Menu options that we can choose from; these can be seen on the picture below:
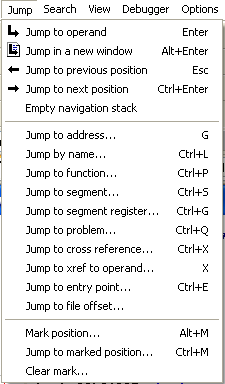
There are many options in the Jump menu and it's good to understand them all to jump around the executable efficiently.
Jump options
Let's say we're looking at the instruction "call address" and we would like to know what the function at that address does. The best way to do that is to set a breakpoint on that location and run the program, and then examine the program when after hits the breakpoint. First, we must set a breakpoint at that virtual memory. We can do this by first traversing to that virtual address and then setting the breakpoint. To go to that virtual address we can use the Jump > Jump to address and enter the address where we would like to jump. On the picture below, we can see that we entered the address 0x00401337.
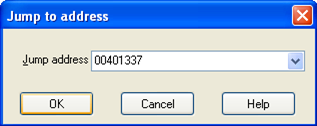
Once we press the OK button, we'll be immediately taken to that address so we can set the breakpoint that we want.
Ida remembers every jump we make using the "Jump to address" functionality and provides us with additional options "Jump to previous position" and "Jump to next position" (also located in the Jump Menu), which can be quite helpful when we want to jump to one of the previous positions. Each jump position is remembered by Ida and will be used by the previous/next jump buttons. The shortcut for the "jump to previous position" is ESC, while the shortcut to "jump to next position" is Ctrl+Enter. There are also two buttons in the shortcut toolbar that can be used to do the same and are presented on the picture below:

Besides jumping to the previous/next location, it can also provide a drop-down list of the virtual addresses where we might like to jump.
Searching for text
We can search for text in the disassembly view by using one of the options presented in the Search menu of Ida. We can see all of the options of the search menu below:
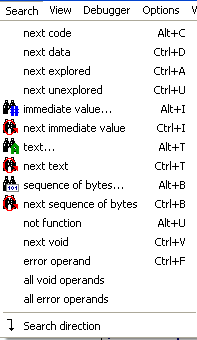
To search for the text in the disassembly view, we need to select Search > Text, which opens the dialog box presented on the picture below:
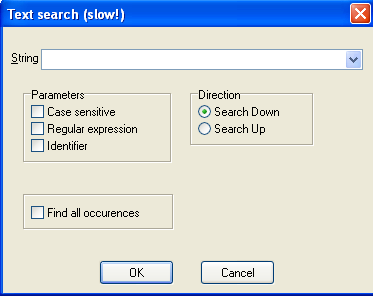
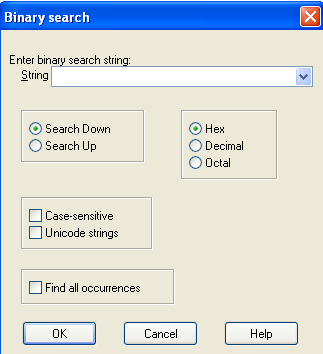
The new dialog lets us type in the string we would like to search for and also choose other options to guide the search algorithm. We can even enter the regular expression to search for. The "Find all occurrences" option will find and display all the occurrences of the inputted string on the screen. The above feature lets us search for text only but we can also search for specific bytes in the executable. Ida has a binary search algorithm that can be invoked by choosing Search > sequence of bytes. The binary search dialog box is presented on the picture below:
Changing the disassembly
Because Ida uses its own representation of the program disassembly stored in the archive database, we can easily make changes to it so that they are distributed to all views accordingly.
The basic thing that we can change in the disassembly is the default names. We know that Ida chooses the default name for functions, where each function is pre-appended with the prefix loc_ followed by the virtual address of the function. Another automatic name assignment happens with parameters of the function and its local variables. These parameters are prefixed with arg_, while the local variables are prefixed with var_. Those aren't the best names for the functions, arguments and local variables, since we can't remember then easily. If we want to easily remember which function/parameter or local variable we're dealing with, it's best to rename it to something more meaningful.
On the picture below, we can see the function named loc_401337 which was taken from the Meterpreter reverse executable. A few lines below, we're calling that function effectively using a loop, but the function name loc_401337 might not be the best name for this function, since we can't easily remember it. Well maybe we can in this case, since the numbers are 1337, which means 'leet', but that's not the point.

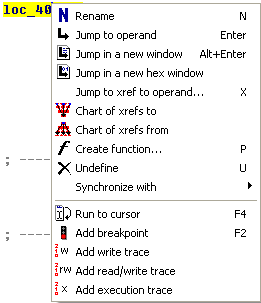 Rather than remembering loc_401337, we could name the function loop or something like it. To do that we can right click on the function and select Rename, as seen on the picture below:
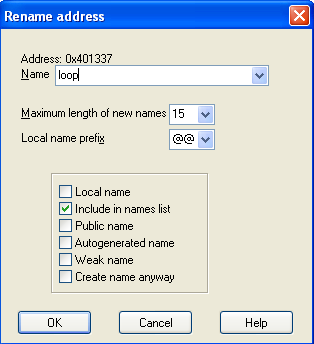
A new window will open where we'll have the chance to change the name of the function. On the picture below, we can see that we changed the name of the function from loc_401337 to loop:
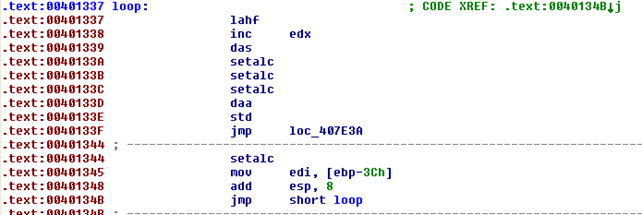
Once we press OK, the changes are automatically distributed across the whole Ida representation of the program. Let's take a look at the picture below, where we can see that the function indeed has been renamed loop. Notice that when calling the function at the address 0x0040134B, we're actually calling the loop function, not the loc_401337 function. This is because the name was automatically applied to the whole disassembly.
If we want to revert to the old loc_401337 name, we can open the Rename window again and enter an empty name for the function, which will tell Ida to regenerate the default name for the function. The "Include in names list" option is checked because we probably want to add our function to the names window. By default, the auto-generated function name isn't added to the names window, but if we're assigning it our own name, we probably want to do that.
Comments
Whenever we're analyzing an executable, we're probably writing down comments about the particular function, address or something else on a piece of paper. While this is a great idea so we can remember what we already analyzed, a better way is to actually write them in Ida itself, so we can also share them with other reverse engineers. We can interact with comments by selecting the Edit - Comments functionality as we can see on the picture below:
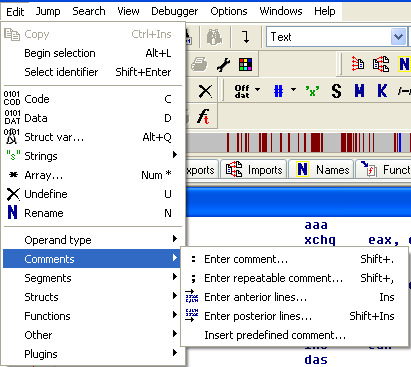
We can see multiple options in the Comments submenu option. We can enter a comment by pressing the shortcut Shift+<dot>, which will add the comment to the current line of the disassembly window at the end of the current disassembly line. We can use either the normal or repeatable comment, which are basically the same thing, and which are both represented with a blue color. The only difference is that with a repeatable comment, the comments are also displayed at the referenced locations whereas the normal comments are not.
On the picture above, we can also see that we can enter anterior or posterior comments, which are full-line comments inserted before or after the current line in disassembly. They are different from the normal and repeatable comments, because those two are appended at the end of the line whereas the anterior and posterior are full-line comments.
Disassembly options
In the settings of the Ida Pro disassembler, there are options that can change the way the assembly code gets shown in the disassembly window. Those options are accessible under Option - General - Disassembly and can be shown on the picture below:
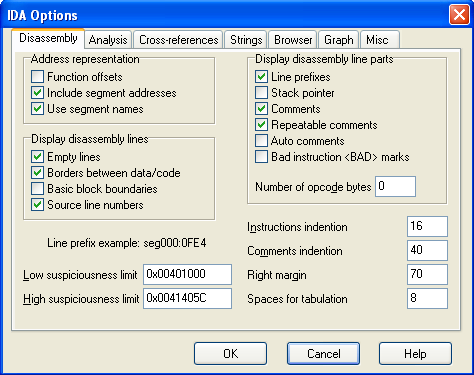
The options are presented as follows:
- line prefixes: displays the section:address for each disassembly line. This is how the Meterpreter disassembled function looks like in Ida Pro when the "Line prefixes" option is disabled:

And if the line prefixes are enabled:

We can see the difference. When the line prefixes option is enabled, each line in the disassembly window actually has the section:address prefixes that are quite useful if we quickly need to figure out the address of the current instruction and the location of it in the binary file. This is why we definitely need to make sure this option is always enabled.
- stack pointer: Is used to instruct Ida that we want to display the relative change of the stack pointer in each function of the disassembly. Let's take a look at a function of the disassembled Putty program when the stack pointer option is not enabled; we can see that on the picture below:
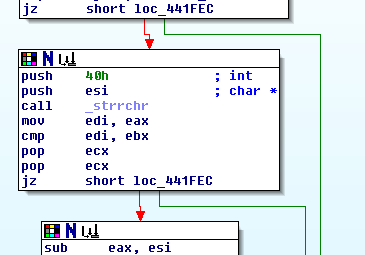
Now let's present the same picture with the stack pointer option enabled:
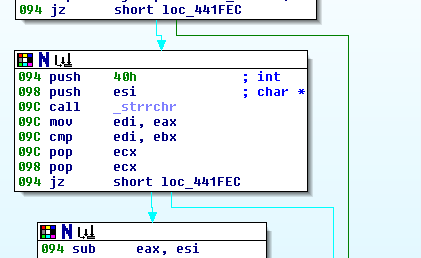
We can see how the stack pointer changes during the execution of the instructions presented on the picture above. We can see that the stack pointer started out as the 0x94 into the function, so we can be pretty sure we're not at the beginning of the function when those instructions are being executed; but that isn't so important at the moment. What's important is the fact that we can actually see how the stack pointer is being changed.
In the first instruction, we can see that we're pushing some number onto the stack, which we know will cause the stack pointer to be increased by 4 and that's exactly what we're seeing; right in the next line, we can see that the stack pointer has increased from 0x94 to 0x98. We definitely want this function enabled, since it can be a great help when reverse engineering certain functions.
- comments: This option is used to enable/disable the showing of comments in the disassembly window. The picture below presents a couple of instructions where the "comments" option is disabled:
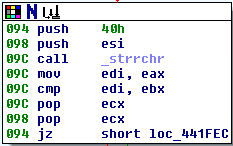
And another picture showing the same piece of code with the comments option enabled:
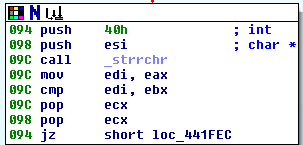
We can see the difference: the comments on the picture above are shown, whereas on the previous picture they are not.
- repeatable comments: This is really the same option as the previous one except it instructs whether repeatable comments are shown instead of normal ones.
- auto comments: This option is used to instruct Ida that we want to turn on the automatic comments that Ida applies to the disassembled code. Let's present the same piece of code as above with the auto comments enabled:
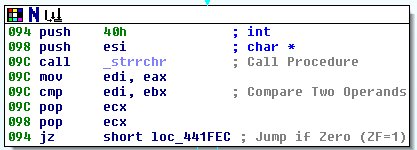
We can see what effect enabling the "auto comments" had on the disassembled window: some of the comments are automatically appended to the code to make it clearer.
- bad instruction <BAD> marks: This option can be used to specifically mark the instructions that can be handled by the processor but are unknown to some assemblers.
- number of opcode bytes: This option specifies how much of the opcode machine bytes we would like to be showing besides the disassembled code. We don't usually want to use this function as we already have the hex view of the disassembled code.
We can also change the representation of the operands in the disassembly window. Let's present the same picture as we already did once again, this time for the purpose of seeing the 0x40 constant:
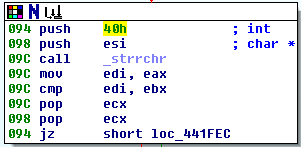
The constant is presented in the yellow rectangle and the value is 0x40h in hex representation. If we want to use other representations like decimal or octal, we totally can. Let's right-click on the constant and see the menu that we get; the menu can be seen on the picture below:

We can see the relevant options in the menu that are used as a representation of the same number: the 64 (decimal), the 100 (octal) and the 1000000 (binary). If we choose the 64 entry, the number will be represented in the decimal form as can be seen on the picture below:
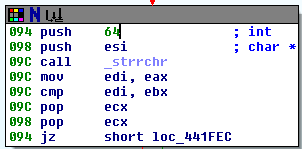
Notice that the number no longer has the h suffix, which can be used to differentiate between the numbers being used in the disassembled window. We can also use a standard constant by right-clicking on the number and selecting the "Use standard symbolic constant." After that, Ida will open a menu of standard constants that hold the same value as 0x40. That same window can be seen below:
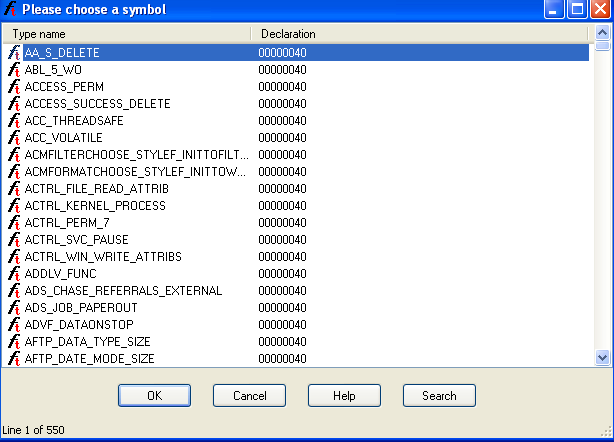
We can see that there are 550 constants that hold the value 0x40 in hexadecimal. We can scroll up and down to choose the name that suits the currently used constant. If we choose the ACCESS_PERM option, the instructions will look as follows:
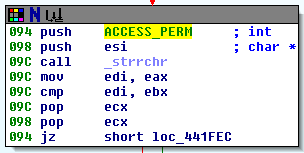
The list of standard constants can be useful if we want to associate a specific constant with its name to save time when analyzing the code again as the code becomes clearer, especially if we're reverse engineering known API function calls.
Conclusion
We've seen various features of Ida that can come in handy when reverse engineering a certain program. First, we looked at how to jump around Ida and search for text, which can be a valuable tip for reverse engineering. If the program uses some kind of string that we can see in the graphical user interface of the program when we run it, then searching for that same string in the disassembled window of Ida can easily point us in the right direction where that certain piece of code is actually called.
Next, we've taken a look at the actual disassembled window and how to change most of its available features. We also looked at the comments that we can add to the disassembly, which is a valuable resource for us if we later decide to analyze the program again and also for other reverse engineers, since we can share the database file with them and they will be able to view all the work that we've already done.

Become a certified reverse engineer!
Sources
Chris Eagle, The IDA Pro Book: The unofficial guide to the world's most popular disassembler.


