Snort Lab: Rule Performance Analysis
There are various for analyzing Snort rules performance. In this lab, we are going to focus on the one that directly applies to rules: Rule Profiling. With this option enabled/configured, Snort will display statistics on the worst (or all) performing rules on exit. Rule profiling has the following format:
config profile_rules: print [all | <number>], sort <sort_option> [, filename <filename> [append]]

FREE role-guided training plans
To enable rule profiling, we need to modify the Snort configuration file. On your Ubuntu Server VM, open a terminal shell and enter the following command:
sudo gedit /etc/snort/snort.conf
Once the file is open, either click on the magnifying glass icon or hit Ctrl+F to open the search window. Type in profile, then un-comment the "config profile_rules" line (see the image below).

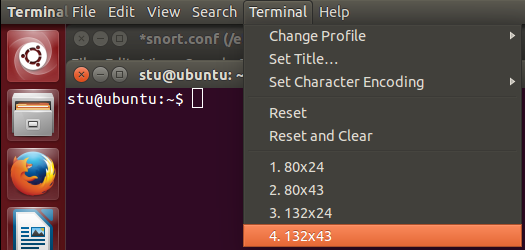
Save the file. Open a new terminal shell. Before starting Snort, let's enlarge the terminal window so it would be easier for us to read the output. With the terminal window active, go to the top of the screen, click Terminal and select one of the wider window sizes.

Now start Snort in the IDS mode. This time, we won't use the quiet ("-q") mode, because we want to see the stats generated by Rule Profiling.
sudo snort –A console –c /etc/snort/snort.conf –i eth0
Now go to your Kali Linux VM and issue some "suspicious" commands that our rules would look at. We could just run a couple of Nmap scans (feel free to try different actions if time allows).
nmap –sT 192.168.x.0/24
nmap –sX 192.168.x.0/24
After the scans are completed, go back to the Ubuntu Server and stop Snort by hitting Ctrl+C. Now scroll up until you see the Rule Profile Statistics (you would see different numbers from the ones in the image below).

We can see that the total of six rules were activated. The rest of the stats have the following meaning:
- Checks - the number of times the Snort engine checks for rule options after the SNORT engine completes an initial analysis to group and pre-screen traffic
- Matches - the number of times the Snort engine finds traffic matching all rule options
- No Matches - the number of times the Snort engine finds no traffic matching all rule options
- Avg/Check (Average ticks) - the average time the Snort engine takes to check each packet against the listed rule
- Avg/Match (Average ticks per match) - the average time the Snort engine takes to check each packet that matches all rule options
- Avg/Nonmatch (Average ticks per no match) - the average time the Snort engine takes to check each packet that did not generate an event
Of course, if you have a lot of rules and lots of traffic, looking at all stats may be difficult. Let's modify the Rule Profile configuration so only the worst five rules would be displayed, sorted by average ticks per no match. Bring up or open the snort.conf file again, find the "configure profile_rules" line and modify it as follows:
configure profile_rules: print 5, sort avg_ticks_per_nomatch

Save the file. Start Snort in the IDS mode and go to Kali Linux. This time, let's try to connect to our FTP server hosted on the Windows Server 2012 R2 VM.
ftp 192.168.x.x
Hit Enter for both Login and Password, then type in exit to return to the prompt. Go back to Snort, stop it (Ctrl+C) and scroll up to the Rule Profile Statistics.

We can see that rule sid:1000017 is on top of the list. Let's open our local.rules file
sudo gedit /etc/snort/rules/local.rules
And take a look at this rule.
alert tcp any any -> $HOME_NET any (msg:"SQL Injection Attempt"; pcre:"/w*((%27)|('))((%6F)|o|(%4F))((%72)|r|(%52))/ix"; sid:1000017; rev:1;)
OK, this is one the rules that uses PCRE, which requires a bit more computational resources when looking at packets. The difference is not noticeable in our tiny lab environment, but you can see that it takes more than five times longer to check each packet than the second worst rule on the list. And this rule didn't even generate any alerts! So, if we didn't look at the stats, we wouldn't have even noticed that the rule is working hard checking all TCP packets and consuming resources without producing any useful data. Let's fix this rule. We know (from Lab 6) that our HTTP server is running on port 8081. So we can modify the rule so it will only check traffic directed towards that port number:
alert tcp any any -> $HOME_NET 8081 (msg:"SQL Injection Attempt"; pcre:"/w*((%27)|('))((%6F)|o|(%4F))((%72)|r|(%52))/ix"; sid:1000017; rev:1;)
Save the file and start Snort in the IDS mode. Now go back to Kali Linux and repeat the FTP connection attempt again. Return to Snort, stop it and look at the Rule Profile Statistics again.

Our rule is off the list! We can verify that it still works by restarting Snort and performing the SQL injection test as described in Lab 6, Exercise 2. The rule works as intended.

Become a Certified Ethical Hacker, guaranteed!
Get training from anywhere to earn your Certified Ethical Hacker (CEH) Certification — backed with an Exam Pass Guarantee.
This is the general approach of using Rule Profiling for analyzing the performance of Snort rules.


