Lab: identifying the use of covert channels
Lab # - Identifying the use of Covert Channels
Most networks use network access control permissions to permit / deny the traffic. Tunneling is used to bypass Access control rules of firewalls, IDS, IPS, Web proxies to allow certain traffic. Also, they are commonly used to cover the tracks.

What should you learn next?
The following are covered as part of this Covert channels lab exercise:
- Covert ICMP tunnels: Ptunnel Tool
- Covert TCP tunnels: Covert TCP Tool
Background
ICMP Protocol dissected: Ping application uses ICMP protocol to communicate over a network. A ping tool is used to test network connectivity by sending requests & listening to replies back. In the below example: Host IP address 192.168.1.5 send a ping request to remote host IP address 192.168.1.4. The default nature of the ping application is to send 32 bytes to the other system. The same is depicted in the below diagram. By default, the 32-bytes contains characters from a-z and will be repeated based on the size of the packet.


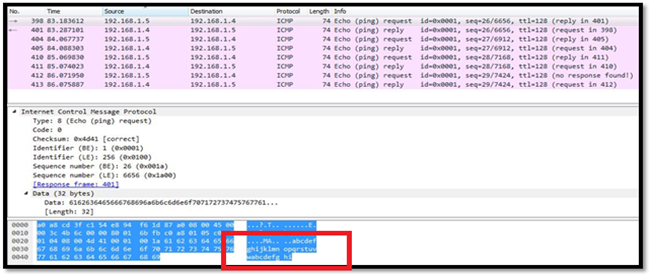
Figure 2: Ping Packets Dissected
The idea behind Ping tunneling is to use the payload portion of the ICMP protocol to encapsulate transport layer protocols (TCP).
Covert ICMP channels using PTUNNEL tool
- Ptunnel stands for "Ping Tunneling".
- It is used to tunnel TCP connections over ICMP Echo requests and replies.
- Written by Danial Stodle
- Available at www.cs.uit.no/~daniels/PingTunnel/
- The author describes the tool can be used "in those times when everything else is blocked."
Setup
- Machine 1 is used for "Application Server". The application server can be any Web server like IIS or SSH Server or Telnet server. In this case, IIS is used as Application Server and Windows is used as Operating system for the Application Server. This system is referred as "Machine 1" in this lab manual.
- Machine 2 is used for covert channel proxy. Ptunnel in proxy mode is used to as covert channel proxy which acts as a bridge between the covert client to Application Server. ENISA VM is used as Operating system for Covert channel proxy. This system is referred as "Machine 2" in the lab manual.
- Machine 3 is used for Application Client and covert client as well. Any Browser can be used as Application client, and PTunnel Client is used for the covert channel. Kali VM is used as Operating System for Application client and Covert channel Client. This system is referred as "Machine 3" in this lab manual.
The below diagram clearly depicts all the three machines used for this exercise.
Deployment diagram
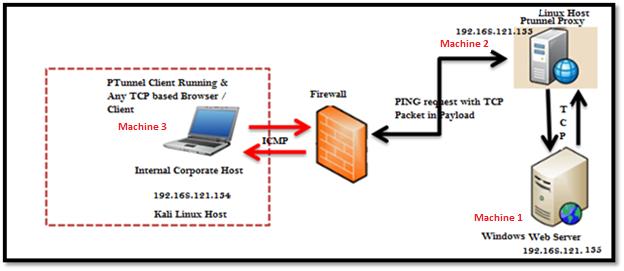
Figure 3: Lab Demonstration
Preparing of Machine 1 (Windows OS)by installing application server
Install the IIS web server on the server box. Below steps show the installation steps for IIS on the server.
Step 1: Click on "Start Button" in Windows OS & click on "Control Panel."
Step 2: In the "Control Panel Window" >> Click "Program and Features."
Step 3: Click on "Turn Windows Features on or off" as shown in below diagram.

Figure 4: Control panel
Step 4: In the Windows Features box as shown below. Check the "Internet Information services" feature as shown below. Click on "Ok" to install the IIS.
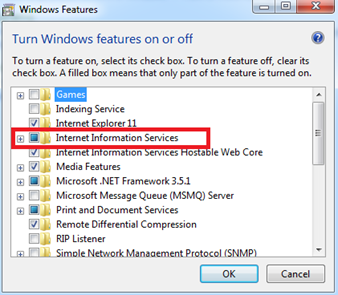
Figure 5: Turn on Internet Information Services
Step 5: To test whether IIS is successfully installed or not. Check the same using Internet Explorer and type localhost in the address bar as mentioned in the below diagram.
Step 6: Click Windows key + R to open run window
Step 7: Type "explore http://localhost" without quotes in the run box as shown below.
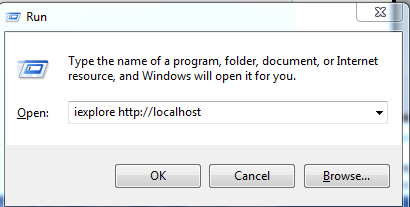
Figure 6: Run box
Step 8: It will open as shown below in figure 6
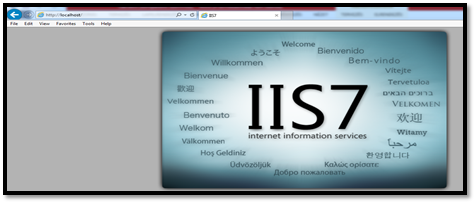
Figure 7: Internet Explorer with localhost
Preparing of Machine 2 (ENISA OS) by installing PTunnel as proxy mode
Wireshark will be run in the background for capturing the traffic.
The IP address configured in this box as 192.168.121.133.
Username: enisa
Password: enisaStep 1: Click on LXTerminal on the desktop to open terminal in Enisa VM
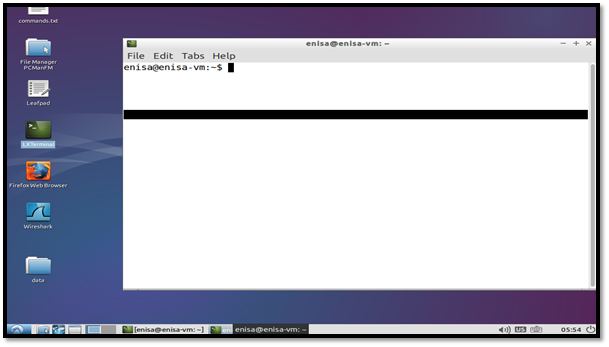
Figure 8: Terminal in ENISA VM
Step 2: Install ptunnel application as shown below.
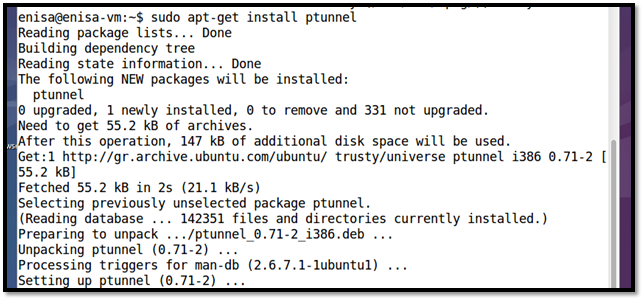
Figure 9: PTunnel installation on ENISA VM
Step 3: Run Ptunnel in proxy mode (Inside Enisa VM). The below command make ptunnel operate in proxy mode, and it will be in listening state.
#ptunnel –v 4

Figure 10: Ptunnel Proxy
Step 4: Open another terminal to run Wireshark for packet capture.
Step 5: Click on the LXTerminal icon on the desktop and type the following command to open Wireshark as shown below. Ignore any warnings displayed.

Figure 11: Run Wireshark in background
Step 6: Configure the Wireshark to put the tool in capture mode by pressing "Ctrl + K" in Wireshark and choose the following:
- Eth0 as interface
- Capture filter with the appropriate IP address & click "Ok."
- Click on "Capture" to start the Wireshark to capture traffic as shown below
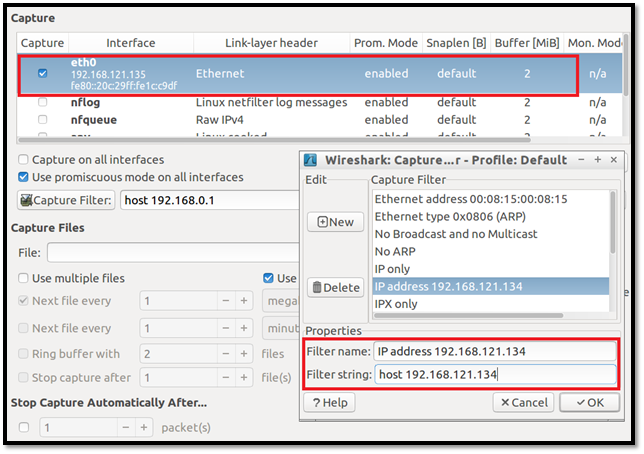
Figure 12: Configure Wireshark
Step 7: Wireshark will be listening for traffic.
Preparing of Machine 3 (KALI OS) by installing PTunnel as client mode
Username: root
Password: too
The IP address configured in this box is 192.168.121.134.Step 1: Open Terminal in Kali VM by pressing "Alt + F2" keys in the keyboard & type "gnome-terminal."
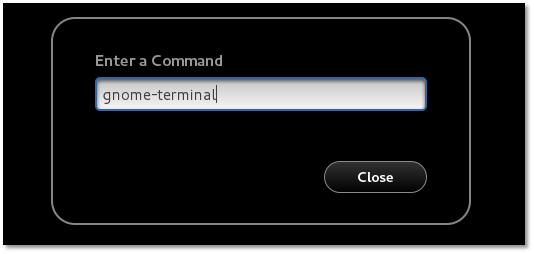
Figure 13: Terminal in KALI Linux
Step 2: In the terminal, type "wireshark&" to run Wireshark in the background. Ignore any warnings displayed.

Figure 14: Running Wireshark in background
Step 3: Configure the Wireshark to put the tool in capture mode by pressing "Ctrl + K" in Wireshark in background process and choose the following options:
- Eth0 as interface
- Capture filter with the appropriate IP address & click "Ok."
- Click on "Capture" to start the Wireshark to capture traffic as shown below
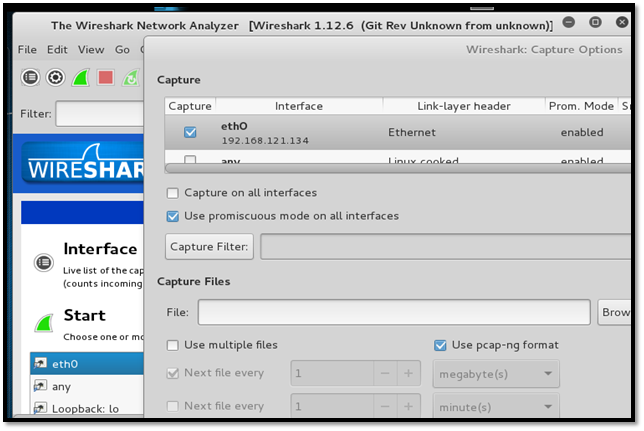
Figure 15: Configuring Wireshark in KALI Linux
Step 4: Open Terminal in Kali VM by pressing "Alt + F2" keys in the keyboard & type "gnome-terminal."
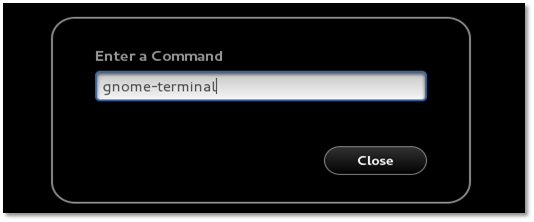
Figure 16: Terminal in KALI Linux
Step 5: Type the below command to run Ptunnel as client mode with the below options as shown in the below figure.
-p : ptunnel to operate in forwarding mode
-lp : Set TCP listening port
-da : Set remote proxy destination address if client
-dp : Set remote proxy destination port if client
-v : verbose level (1 to 4; where 1 is no output and 4 is all output)

Figure 17: PTunnel Client
Step 6: Open a browser by typing "Alt+F2" and type "Firefox localhost:8000" as shown below.
The above command opens Firefox browser and access localhost on specified port 8000.
Tip: use private browsing for opening the tab as there will not be any cache stored.
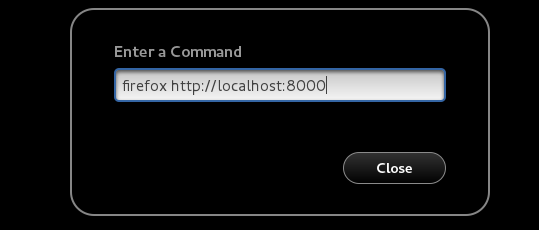
Figure 18: Open Terminal in Linux
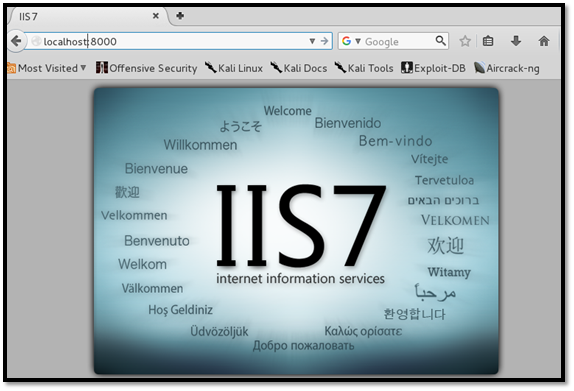
Figure 19: Invoking Web page from client
Step 7: Browser sends TCP packets over ICMP using PING application to the ptunnel proxy as depicted in the below command. The same is captured by the Wireshark tool running in the background.
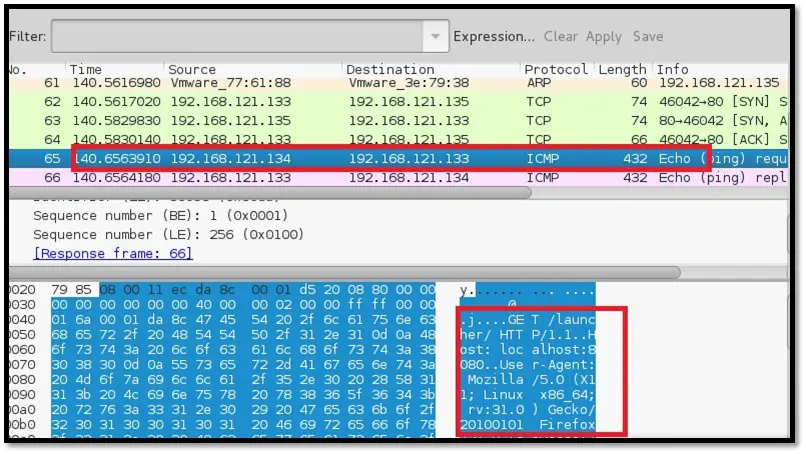
Figure 20: Web traffic over ICMP / PING
Step 8: From machine 2, Ptunnel proxy will receive the ICMP packets and strip the embedded TCP request and forward the same to ptunnel server as shown below.
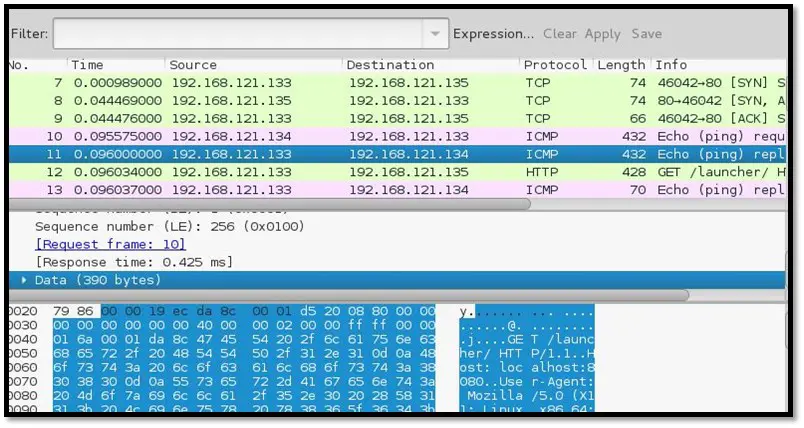
Figure 21: Proxy sending over TCP to server and ICMP to client
Step 9: On receiving the ptunnel proxy tcp request. The server will send the response back to the Ptunnel proxy.
Step 10: Ptunnel proxy in-turn will send the response back to the ptunnel client.
Step 11: For more help on ptunnel use the below options.
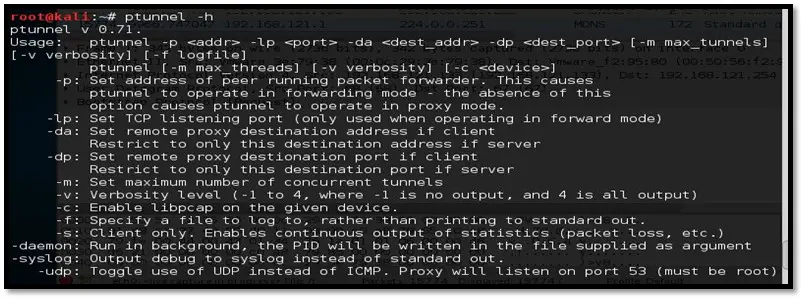
Figure 22: Ptunnel Help
Behind the scenes
Wireshark packet captures are attached for further analysis.
The packet capture 133.pcapng is from Machine 2 and 134.pcapng is from Machine 3.

Covert_TCP tool
- The code is available at http://www-scf.usc.edu/~csci530l/downloads/covert_tcp.c
- This tool helps in carrying covert traffic inside of unused fields of TCP and IP headers.
- Written by Craig H. Rowland (crowland@psionic.com)
Encapsulating of one protocol inside another protocol will be a very effective mechanism as shown in the previous example. But Covert channels can also be constructed by inserting data into unused fields of protocol headers. Many of the unused or misused fields in TCP or IP over which data can be sent.
Compiling the covert_tcp program:
Step 1: download the code from http://www-scf.usc.edu/~csci530l/downloads/covert_tcp.c or a copy of the source code is placed here.

Step 2: Open a terminal by pressing "alt + F2" and type gnome-terminal as shown below.
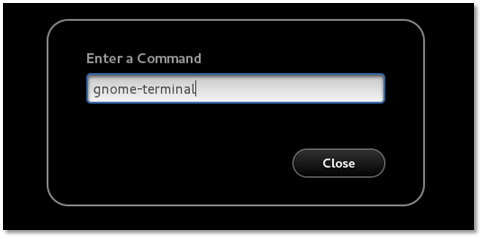
Figure 23: Run Terminal in Linux
Step 3: Move the source code to the VM Desktop and compile the same with the below command.
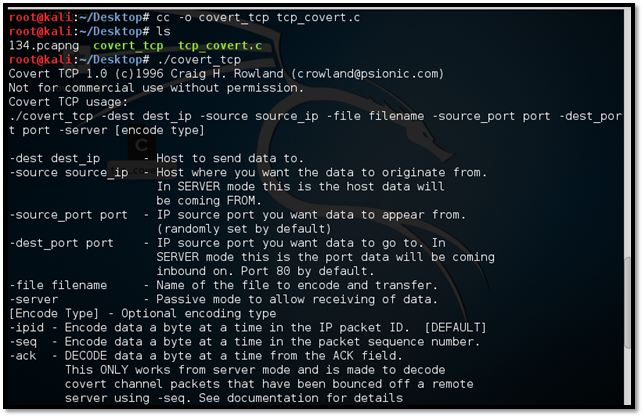
Figure 24: Compiling the code
Step 4: Create sample file to send in the appropriate directory as shown below.
#mkdir send
#cd send
#echo "Hello There" > send.txtStep 5: Create another directory to receive the data sent from the sender as shown below.
#cd /tmp
#mkdir receive
#cd receive
Step 6: Open four terminals: Terminal 1 for sender and Terminal 2 for the receiver and Terminal 3 for the listener and Terminal 4 for sniffing the communication. All terminals are opened with the below command. The same action is repeated for four times.
Step 7: Open a terminal by pressing "Alt + F2" and type gnome-terminal as shown below.
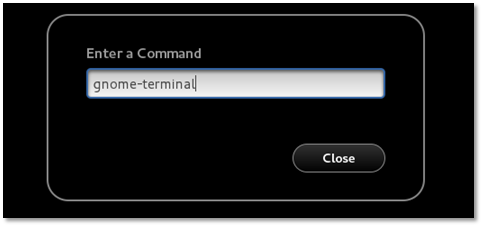
Figure 25: Open Terminal in KALI Linux
Step 8: In terminal 1, start running a sniffer using tcpdump
with the below command
Step 9: in Terminal 2, Create covert_tcp listener. This listener will wait for the data from the localhost. Data arrived at local port 8888 and sent to destination TCP port 9999. The received data will be sent to the file receive.txt as shown below.
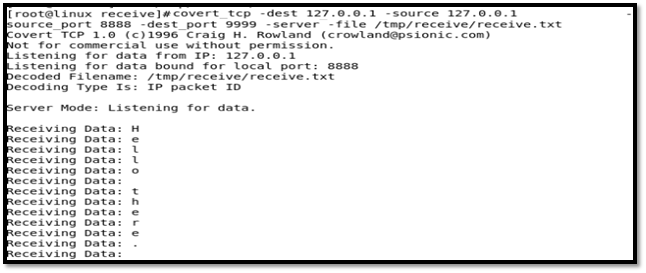
Figure 26: Covert_TCP Receiver Console
Step 10: In Terminal 3, Create covert_tcp sender. This file should be sent one character at a time as TCP is stream based service as shown below.
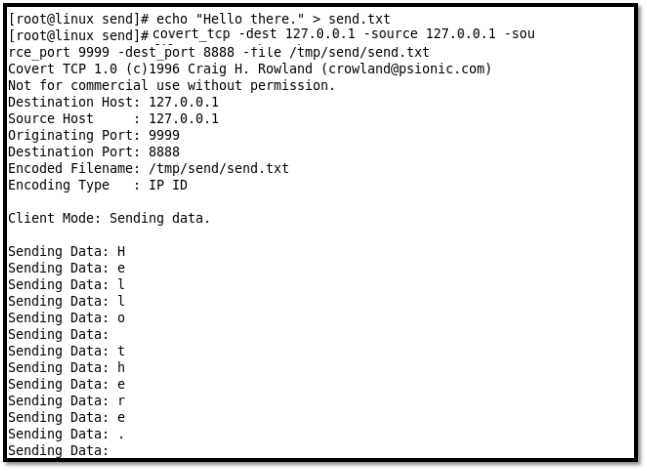
Figure 27: Covert_TCP sender's console
Step 11: In terminal 3, view the received file.
Step 12: Back in terminal 1, View the sniffed communication with tcpdump tool output. As you can see, the text "Hello there" is sent one character in each packet. The same is circled in the below figure.
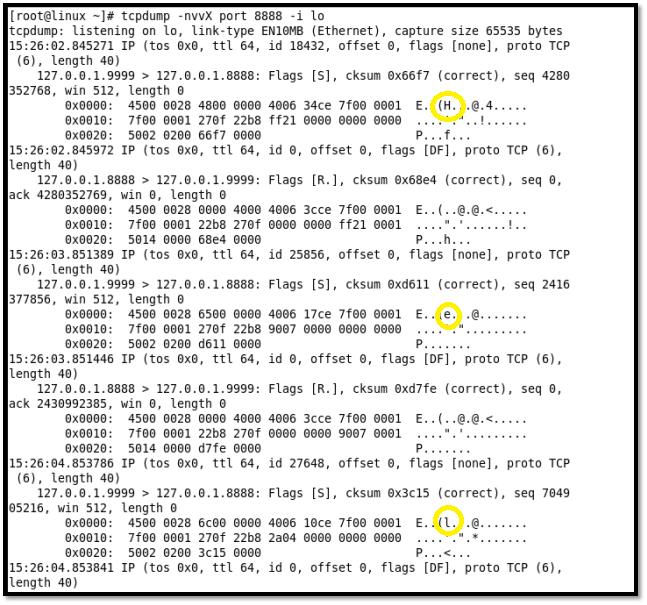
Figure 28: Console showing Sniffed data
Sources
http://www.mit.edu/afs.new/sipb/user/golem/tmp/ptunnel-0.61.orig/web/
Become a Certified Ethical Hacker, guaranteed!
Get training from anywhere to earn your Certified Ethical Hacker (CEH) Certification — backed with an Exam Pass Guarantee.


