Page tables, VAD and PEB
In this part of the series, we will understand how the process can be enumerated within memory. Just as a refresher in part 1 of this series we had a look at the process organization in Memory & Volatility plugins which helps to find such processes. In this article, we will take a look at the Page Tables, Virtual Address Descriptors (VAD), and Process Environment Block (PEB).
Page tables
The role of page tables is to provide mapping from Virtual Address to Physical Address in Random Access Memory (RAM) and to determine that what pages for a specific process are swapped to disk. Remember that continuous virtual address does not necessarily map to continuous addresses in RAM and thus can randomly point to any location in RAM (I am assuming here that the reader's know how paging works.)

What should you learn next?
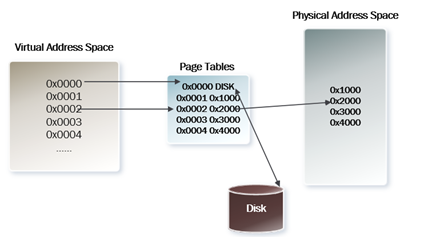
Now as you might have guessed by now, every process has a set of pages allotted to them. Volatility provides us two plugins: mem dump and memmap to enumerate through these structures.
Memmap plugins provide a listing of mapping from Virtual Address to Physical Address. Below is output from memmap plugin:
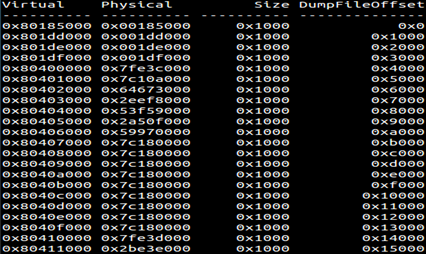
Memdump plugin is used to dump the memory for a particular process. To view the contents at a particular memory address, DumpFileOffset field value of memmap output can be used as an offset into the .dmp file.
Virtual address descriptors (VAD)
So far we have looked found the processes in memory and then for a particular process we know ow to see what all pages assigned to that process. What is really inside the pages i.e. what DLL's are mapped or what executables occupy that space? VAD structure is a self-balancing tree with child nodes on the left and right side of the parent node. Each node has some flags associated with it which are very useful during an investigation.
- Protection: This field gives an indication of the type of access allowed to the memory region. Some of the protection constants are:
- PAGE_EXECUTE: Memory can be executed but cannot be written to
- PAGE_EXECUTE_READ: Memory can be executed or read but cannot be written to
- PAGE_EXECUTE_READWRITE: Memory can be executed, read and write.
- PAGE_NOACCESS: No access to this memory region
- PAGE_READONLY: Only read access to the memory
- PAGE_READWRITE: Read, Write access to the memory but no execution.
- Private Memory: This field refers to committed regions that cannot be shared with other processes.
Now in Volatility, there are three plugins that can be used to look into these VAD nodes.
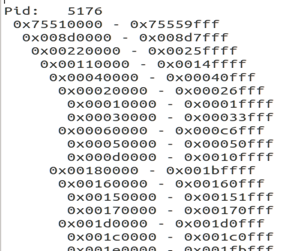
- Vadtree: This plugin of volatility shows the VAD tree that can be used to see the memory ranges for a particular process. For example below is a screenshot of vadtree in action
- Vadinfo: This plugin helps us to find what each memory range corresponds to, what its protection settings looks like etc. For example below is a snapshot from two consecutive VAD regions for this process.
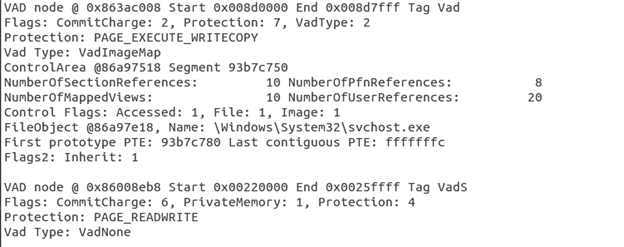
Important points from above vadinfo output:
- We can see the start and end limits of the vad region.
- It has a protection of PAGE_EXECUTE_WRITECOPY which enables read-only and copy-on-write access. Later in the series when we will see Volatiity plugin malfind then understanding of Protection field is important.
- CommitCharge: This value specifies the number of committed pages in the region and pairing with physical addresses are being done. When there is no CommitCharge, then it means that memory has only been reserved but not paired with physical addresses.
- Tag: It defines the type of structure that the tree will follow. It is extracted from the PooolTag member of the _POOL_HEADER. Node types are _MMVAD* structure and are usually Long and Short type. An important point to note that _MMVAD_SHORT structure does not contain a subsection. Thus it cannot map a file. VadS and VadF are of _MMVAD_SHOR type. So when looking for injected regions, look out for VadS or VadF tag type as the region won't be backed up by a file. IN the above example one node is of type Vad whereas the other is of type VadS.
- Vaddump: This plugin extracts the entire memory region for a particular process and writes them to a separate output per region. These output files are usually appended with zero's so that consistency among the regions can be maintained.
Process environment block (PEB)
As we saw in the previous article while going through the _EPROCESS structure, PEB member points to some important artifacts about a processes memory like the complete path to a process executable, current working directory, pointers to linked lists, heaps handles, etc. Looks murky, well let's see PEB structure and others which its members points to. Below is a screenshot of how PEB looks like in 32-bit Windows 7 machine.
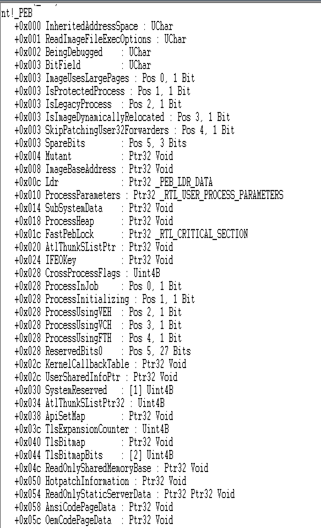
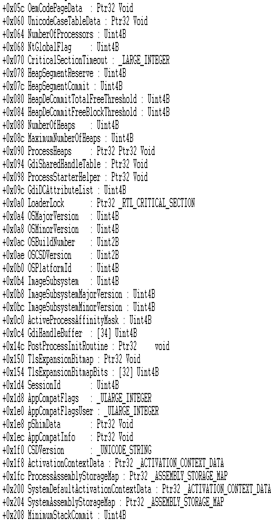
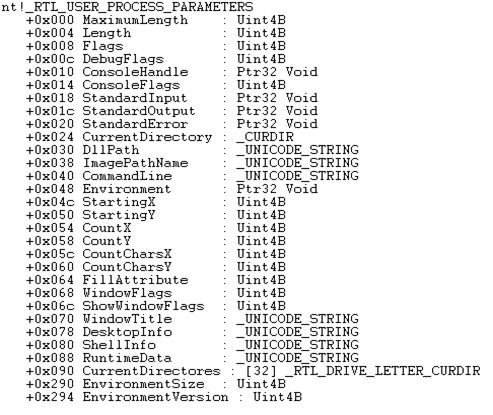
Below is a screenshot of process parameters structure
Below is a structure _PEB_LDR_DATA which shows three doubly linked lists

Below is a structure _LDR_DATA_TABLE_ENTRY
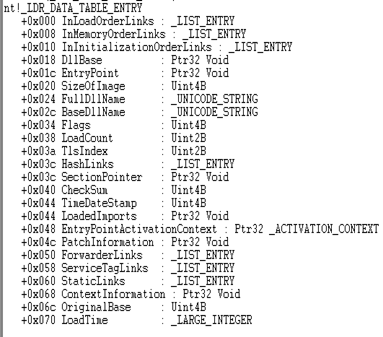
Some important fields from all these structures

FREE role-guided training plans
- ImageBaseAddress: Member of PEB and this points to process memory where the main executable is loaded.
- CurrentDirectory: This is a member of _RTL_PROCESS_PARAMETERS structure and shows the current working directory of application
- CommandLine: Member of _RTL_PROCESS_PARAMETERS and shows Full Command Line used to invoke this process
- ImagePathName: Member of _RTL_PROCESS_PARAMETERS and shows Full Unicode path to process executable on disk.
- DLL Base: Member of _LDR_DATA_TABLE_ENTRY and shows the base address of the DLL in process memory.
- FullDLLName/BaseDLLName: Member of _LDR_DATA_TABLE_ENTRY and shows Full /base portion path to DLL in process memory.
- InLoadOrderModuleList: Member of _PEB_LDR_DATA .This will organize executables/DLLs in the order in which they are loaded into a process. Process executable is always the first in the list.
- InMemoryOrderModuleList: Member of _PEB_LDR_DATA .This will organize executables/DLLs in the order in which they are loaded into memory.
- InIntializationOrderModuleList: Member of _PEB_LDR_DATA .Organized order in which DLLmain function is executed.
- EntryPoint: Member of _LDR_DATA_TABLE_ENTRY and shows the first instruction executed.
So in this article, we learn how to parse Pages, VAD, and PEB for a particular process. In next article, we will look at how to parse heaps, environment variables, DLLs, etc.


