Traffic Anomaly Detection – TCP and DNS
Ever since the computer and the critical data it holds came into headlines, so did the malicious programs, attacks and the threat landscape. We have thousands of cases of malware infection, zombies and trojans taking over networks in fast pace. The amount of data that passes through any switch, router, Firewall is enormous. There is 'gigabits of traffic' flowing every second through perimeter and internal networking devices. To protect this vast amount of data, we have deployed host as well as network level controls and software. Every security measure we deploy makes it one step harder for the attackers to gain access to the internal resources. There are devices that check for malware patterns, do heuristic scans, and find patters that resemble a black listed file or a cyber-threat. This technology is termed as Deep Packet Inspection (DPI) for it inspects the payload as well as the protocol details of every packet against the set of signatures to match. But, with the constant evolution of attack vectors it's now a crazy fire-fighting exercise to match every type and strain of malware or every style and patterns of an attack. Moreover the detection capability bridge between malicious and benign software is shrinking rapidly.
Can we have something that can help is narrow down the spread of a malicious file. If we miss the perimeter checks, can we still deal with the spread of the malware? Yes! To some extent by using traffic anomaly detection together with other host based solutions. So, what is Traffic Anomaly? Straight answer is – anything which is not expected in day-today traffic; something that creates an anomaly and raises an alarm. It can be huge amount of requests, response, particular TCP flag, DNS queries, anything. Here I will discuss TCP anomaly with an in-house detection script as well as the DNS anomalies. This is not a full and fool proof measure of detection, but surely can complement your existing security solutions.

Learn Vulnerability Assessments

Learn Vulnerability Assessments
TCP Protocol – Deep Dive
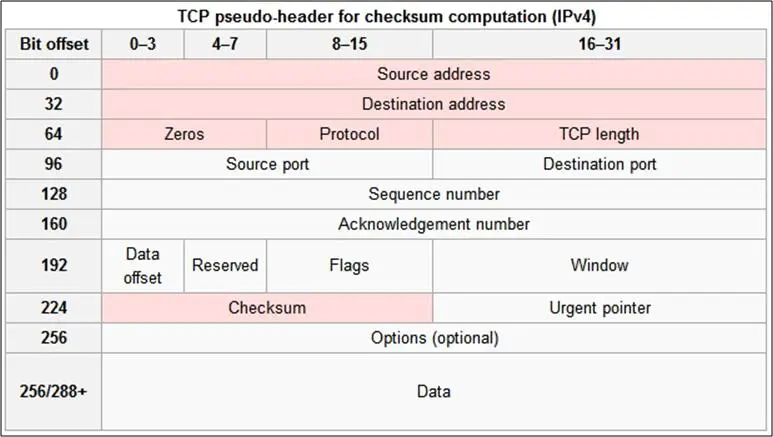
TCP of Transmission Control Protocol and is often referred when dealing with high level protocols such as HTTP, FTP etc. A high level analysis of TCP header is shown in Figure 1. The key fields in scope of this article are 'Port', 'Address' (Source/Destination) and very importantly the 'FLAGS'. These fields will help identify if there is an anomaly occurring in network traffic without digging deep into the packet payload and patterns. We know how address and port are connected to call it a socket, but how can we devise a simple yet effective measure on the basis of flags. Even though there are 9 flags of 1 bit each, still let's take a brief overview of 4 most often used flag types,
-
SYN
It is derived from the word 'Synchronize'. Ideally in the start of the connection the first packet sent from each side (client and server) should have this flag enabled.
-
ACK
It is derived from the word 'Acknowledge'. It means that the received packet has been acknowledged.
-
FIN
This flag indicated that the host will not accept any more packets and is requesting a termination of connection.
-
RST
It forcibly RESETS the connection. When this flag is enabled, the host doesn't wait for response and is terminating the connection right away. It's more offensive way to terminate connection.
Figure 1 (Source: Wikipedia)
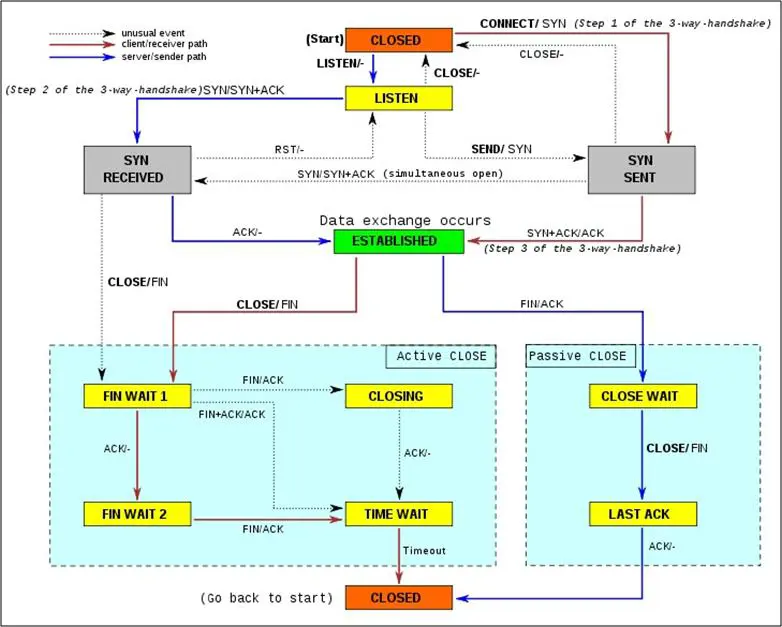
Now, after having a brief idea on the flags, let's see how the connection is established. It's a typical three way handshake as shown in TCP state diagram in Figure 2. So, one thing is clear that if a host is trying to connect to another host, it will initiate a SYN. Similarly, if a host has to refuse a connection it will send an RST, or if it has to accept it then an ACK. Now, can we leverage this knowledge to check if there is an anomaly in the network? Let us assume a host in the network is infected with a malware and it is trying to spread in an internal network. We can expect a lot of packets being generated by the infected machine and lots of drop connection received. This is the key to the checks we will deploy via an in house python script. For ease of explanation let us say we have an infected host HOST-A and various other hosts on the LAN such as HOST-B, HOST-C …
Case-1
So, if malware at HOST-A has the capability to spread in the LAN like a worm, then it will surely try to initiate the connections with HOST-B/C. Therefore we can expect HOST-B and HOST-C receiving SYN flags from HOST-A. Now, if these are end user systems, it points to an anomaly as why would a user on HOST-A attempts to connect to a user HOST-B (if not a business requirement). So, if we have the tool running on HOST-B that can check the SYN packet count, we can then use it as a counter to validate the SYN packets per IP against a threshold value. It can also trigger on a port scan from HOST-A to HOST-B with the sudden hike in SYN packets.
Case-2
On the other hand if the HOST-A receives many packets with RST flags enabled, it means that the target machines denied the initiation of TCP connections. We can infer as if the HOST-A receives too many RST flags, there is a probability that the machine HOST-A is trying to scan the nearby systems with SYN flag set.
So, too many SYN received means the SENDER is infected (Figure 3), and too many RST received means the RECIPIENT is infected (Figure 4).
Figure 2 - TCP State (Source: Wikipedia)
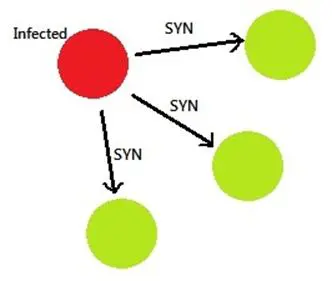
Figure 3 - SYN Packets
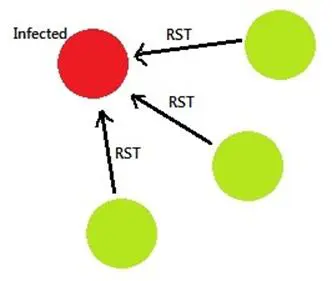
Figure 4 - RST Packets
Now, let us go through the python script to understand what it can do, and how to make it work. This is working draft of the script, and may need a revamp, or beautification but logics and working is fine. The python script uses scapy to do the packet analyses and counters to take care of the packet count for each flag. Here is an output screenshot for the script (Figure 5 and Figure 6).

Figure 5 - Flags Counter
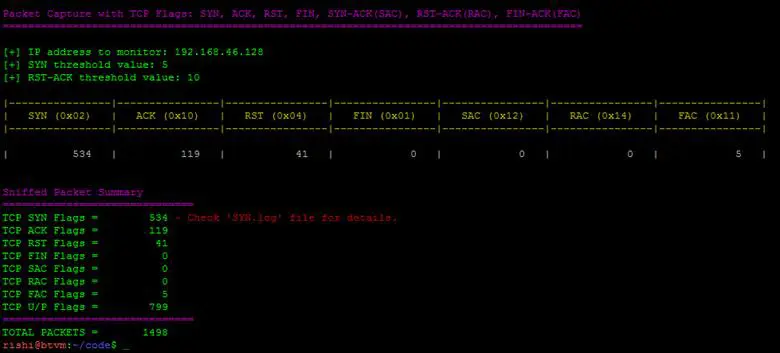
Figure 6 - Tool Summary
Tool Working
The script is coded in python and is using the network packet analysis library (scapy) to count, and print the required fields of the packets. Here are the steps with brief understanding,
-
Importing required libraries.
import logging
logging.getLogger("scapy.runtime").setLevel(logging.ERROR)
from scapy.all import *
from math import *
import sys, os
import ConfigParser
import string
from termcolor import colored, cprint
-
Configuration Parameters from "flags.ini" file (Figure 7). This file has to be manually configured with IP address, and the threshold SYN and RST values.
# Configuration Parameters
config = ConfigParser.ConfigParser()
config.read("flags.ini")
SYNVAL=config.get("flag", "SYN")
RACVAL=config.get("flag", "RAC")
IPMON=config.get("target", "IP")
RACVAL = string.atoi(RACVAL)
SYNVAL = string.atoi(SYNVAL)
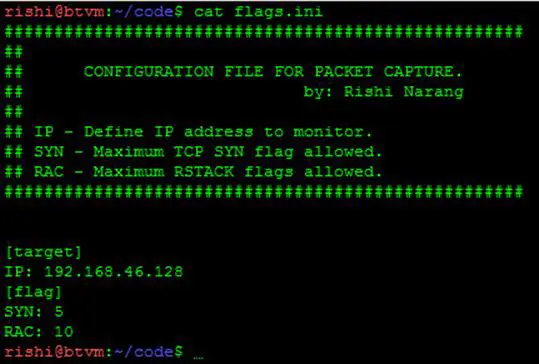
Figure 7 - Flags INI file
-
Then, there is a class for packets and flags in the respective packets.
# Counter Class for packets & flags
class COUNTER:
def __init__(self):
self.S = 0
self.A = 0
self.R = 0
self.F = 0
self.SA = 0
self.RA = 0
self.FA = 0
self.T = 0
def countit(S=0, A=0, R=0, F=0, SA=0, RA=0, FA=0, T=0):
c.T = c.T + 1
if S:
c.S = c.S + 1
elif A:
c.A = c.A + 1
elif R:
c.R = c.R + 1
elif F:
c.F = c.F + 1
elif SA:
c.SA = c.SA + 1
elif RA:
c.RA = c.RA + 1
elif FA:
c.FA = c.FA + 1
print colored("| %10d | %10d | %10d | %10d | %10d | %10d | %10d |" %(c.S,c.A,c.R,c.F,c.SA,c.RA,c.FA),'white'),"r",
def findFLAG(p):
IPSRC = p.sprintf("%IP.src%")
IPDST = p.sprintf("%IP.dst%")
if IPDST == IPMON:
countit(T=1),
FLAG = p.sprintf("%TCP.flags%")
if FLAG == "S":
countit(S=1),
saveout= sys.stdout
fsock = open('logs/SYN.log', 'a+')
sys.stdout = fsock
print p.sprintf("nSource = %IP.src%:%TCP.sport%nDestination = %IP.dst%:%TCP.dport%n%TCP.payload%")
sys.stdout = saveout
fsock.close()
if FLAG == "A":
countit(A=1),
if FLAG == "R":
countit(R=1),
if FLAG == "F":
countit(F=1),
if FLAG == "SA":
countit(SA=1),
if FLAG == "RA":
countit(RA=1),
saveout= sys.stdout
fsock = open('logs/RAC.log', 'a+')
sys.stdout = fsock
print p.sprintf("nSource = %IP.src%:%TCP.sport%nDestination = %IP.dst%:%TCP.dport%n%TCP.payload%")
sys.stdout = saveout
fsock.close()
if FLAG == "FA":
countit(FA=1),
c = COUNTER()
sniff(filter="tcp", prn=findFLAG, store=0)
-
After these packet flags are calculated, and reach a threshold limit, then a log file is generated (Figure 8)
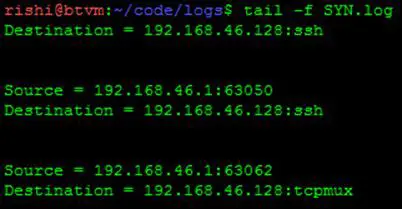
Figure 8 - SYN log file
With this brief overview, following are the changes in next versions,
- Parse the log file to get the most 'active' IP address.
- If on a Linux host, with a strict rule the tool can release the DHCP lease.
- P2P model to let the scripts interact with each other on different hosts and isolate the malicious IP address as a network of analysis. This will make the anomaly detection a holistic approach.
DNS Anomaly
In continuation to TCP anomaly detection based on the TCP flags, the DNS anomaly detection can also be embedded into the script. The infected system not only detects the hosts in the network for infection, but also tries to connect to their control centers in external zones. Such infected hosts scan the internal networks for open ports to spread, and contact the external servers by initiating the DNS queries to the malicious domains. A popular and well known technique used by worms controlling domains is the fast-flux. This enables the writers to have a pre-configured domain generating algorithm, and book the domains accordingly. A worm initiates a huge number of DNS queries and this constitutes the anomaly in the network. But, it can result in false positive so the tools need to be heuristic, intuitive as well as able to interact with different tools running on separate hosts.
On the other hand, there are times when worms/ or malicious programs generate DNS packets that violate the format of a valid DNS header. This can be detected at the network level as well as in a well formatted host based script that has the capability to parse the packets and decode DNS traffic for validations. Once we have the anomalies detected, we can look into the action items for the source IP addresses.
TCP sessions vs. DNS queries – There is a close relation between the DNS query and the successive TCP session. In an ideal scenario there should be a 'threshold' time of session after a successful DNS query. But, it can be termed as an anomaly if there are lot more DNS queries than number of long-term TCP sessions. Here is a short list of pointers to a DNS traffic anomaly,

Learn Secure Coding Fundamentals

Learn Secure Coding Fundamentals
-
Sudden hike in DNS queries from a singular IP address.
-
Sudden drop in successful DNS queries. Drop in resolved queries.
-
Increase in the number of DNS queries vs. successful TCP sessions.
-
A jump in the recursive queries.
Overall, the next step is to develop and code these ideas into the tool, and have a single standalone tool capable of parsing traffic and detecting different anomalies – TCP and/or DNS at the host level. It can then take the required actions on the basic of configuration.

