Incorporating Cloud Security Logs into Open-Source Cloud Monitoring Solutions

Introduction
In the previous article, we gave an overview about setting up the environment for open-source monitoring of logs across a wide range of devices. In this article we'll take up from there, use the environment that has already been provided, and incorporate logs from various systems to be sent to ELK stack. To summarize quickly what we have done: we've used Elasticsearch, Logstash and Kibana to setup an environment capable of storing, analyzing and presenting gathered logs from different systems.
For those of you who already know what an ELK stack is and want to skip ahead right into the current article without bothering to read the previous one, you can get the environment by using Docker as follows. Note that the "-v /etc/localtime:/etc/localtime:ro -e 'TZ=Europe/Ljubljana'" option is necessary to use the host time in docker container in order to keep the time synchronized – otherwise the events coming from the outside will have incorrect time, which doesn't help us when trying to gather information about a breach.
Learn Network Security Fundamentals
# docker run -it -d -p 5000:5000 -p 5514:5514 -p 5514:5514/udp -p 5601:5601 -p 9200:9200 -v /etc/localtime:/etc/localtime:ro -e "TZ=Europe/Ljubljana" proteansec/elk
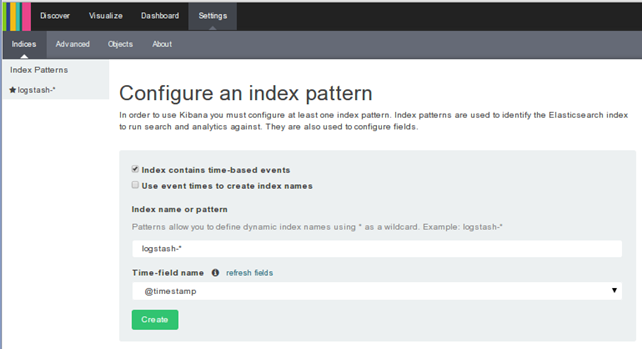
The image uses the supervisord daemon to start all needed services, so nothing more needs to be done in order to start processing logs. After that we can connect to the http://docker:5601/ IP:PORT and observe the Kibana interface asking us to configure the index pattern. At this point, we should basically press the Create button to create an index pattern used by Elasticsearch for searching and analysis.
Sending Cloud Security Logs to Logstash
In order to start gathering logs on one central location, we have to configure every cloud system to send the logs to the central ELK docker container we've previously set-up. We need to send the logs to the logstash component of the ELK stack, which is already configured to listen on ports 5514 (syslog) and port 5000 (tcp) as can be seen in the /opt/logstash/conf.d/10-syslog.conf configuration file. If we nmap port 5000 or 5514 from a remote system, which is part of the same LAN, the ports should be open and ready to receive any syslog messages.
input {
  syslog {
    port => 5514
    type => "syslog"
  }
  tcp {
    port => 5000
    type => "syslog"
  }
}
In order to send logs to syslog logstash receiver on port 5514, we have to setup rsyslog and configure it appropriately to send all the logs to logstash. In order to do that, we have to install the rsyslog package via the default package manager.
# apt-get install -y rsyslog
Then we need to add a configuration file to the rsyslog configuration directory /etc/rsyslog.d/. We can create a file /etc/rsyslog.d/10-logstash.conf and add the following, which will send all the logs to docker host on port 5514 (replace the host 'docker' with the domain name of the server running the ELK docker instance). The configuration below basically states to send messages from every subsystem and every priority to the docker host on TCP port 5514 (note the double @; a single @ denotes UDP protocol is used).
*.* @@docker:5514
We can automate the above with fabric Python library, which enables running commands on remote systems by sending the commands over SSH in order to automate deployment and administration tasks. In order to do that, we have to create a simple fabfile.py containing all the necessary instructions to install and deploy the rsyslog script. Then we need to run the fab command in the same directory, which will automatically detect the presence of fabfile.py and will allow us to execute commands from the file.
A simple fabfile.py can be seen below, which contains the run_command function that differentiates between the normal and sudo commands, and runs them appropriately. Then there's also the rsyslog function, which runs the necessary commands to install rsyslog and write the corresponding configuration file; note that the function accepts the host:port parameters, which define the server that listens for incoming connections.
Because we've set the env.use_ssh_config to true, the script will automatically pull the settings from the /home/user/.ssh/config configuration file, so we don't need to specify the username/password settings for the connection to succeed. The env.hosts specifies the hosts where the commands will be executed, but the connection to the server should succeed without prompting for credentials by simply SSH-ing to the server in question.
[python]
from fabric.api import *
from fabric.contrib import *
from fabric.colors import green, red
import os
env.hosts = ["docker"]
env.use_ssh_config = True
env.parallel = True
def run_command(command):
"""
Function that runs certain commands with sudo privileges.
"""
try:
if command.strip()[0:5] == "sudo":
results = sudo(command)
else:
results = run(command)
except:
results = 'Error'
return results
def rsyslog(server='docker', port=5514):
"""
Install packages on the destination server.
"""
run_command("sudo apt-get install -y rsyslog")
run_command("sudo echo '*.* @@"+server+":"+port+"' > /etc/rsyslog.d/10-logstash.conf")
run_command("sudo service rsyslog restart")
[/python]
You might think the script is not required and that it only complicates things, but it really depends on the number of servers you have to administer. If you have only one server, then you could also install the packages and edit the configuration files manually, but otherwise it's advisable to use fabric to automate repetitive tasks. We can run the following command to send logs to docker server on port 5514, but we can change the host:port depending to our wishes right from the command-line without changing the fabfile.
# fab rsyslog_server=docker,port=5514
The provided fabfile can be run on any Linux distribution supporting deb packages like Ubuntu, Debian, etc. When different Linux distributions are used, we might want to change the package manager apt-get that was used above.
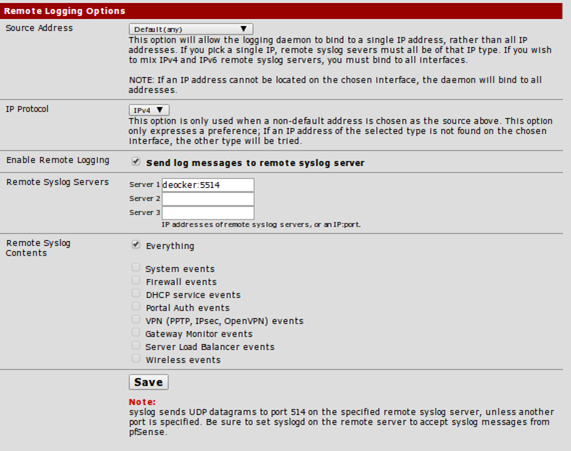
To setup remote logging on Pfsense, we have to go to the Status – System Logs – Settings, where we can edit the remote logging options as presented below. Note that we've enabled the option "Send log messages to remote syslog server" and inputted the remote logging server into the "Server 1" field.
Now we've configured all the servers to send system logs to ELK stack, which is listening on TCP port 5514. Now we only have to wait for the systems to send logs to the ELK stack where they are centrally gathered.
Persisting the Data
When playing with Docker images, we'll soon figure out that data inside Docker containers does not persist, but is available only throughout the life of a Docker container. Note that docker container can be stopped and started by using "docker stop/start
container" commands, but when using the run command, a new docker container will be created from an image without the previously gathered data. It's usual to interact with a docker container df5b21f2071c with the following commands.
# docker stop df5b21f2071c# docker start df5b21f2071c
A better way to persist the data is through a data container, which is a separate docker container containing only the data for another container. Keeping data in a data container isn't the point of this article, so if you're interested, you'll have to check out the docker documentation.
Detecting Important Events
Now that we've setup every system to send log information to an ELK docker container, we have to analyze the gathered data in order to detect anomalies on the systems to detect intrusions. The important thing to realize is that when checking for system anomalies, we don't have a set of rules, which can be imported into the system in order to check for all kinds of anomalies. There are multiple events being triggered at various actions generated either by the system itself or by an attacker gaining access to the system. In any case, we should not discard any of the messages, but should investigate all the generated messages. At this point, it's wise to assume that system security is an ever-evolving process, which must be handled appropriately.
One of the events that should be handled is VPN login events generated when a user authenticates to the VPN server. More specifically, we should track the IP addresses of users in order to determine whether a VPN connection was established from an IP halfway around the world. If an employee is usually connecting from his home IP address present in the same country, an authentication from a far-away IP address is suspicious, and should be investigated. If an employee has left the company for a conference or a holiday at the time of event generation, then VPN authentication is valid, but in every other case, it should be regarded as highly suspicious.
The OpenVPN server generates the following events at each successful user authentication – note that the sensitive information like a username and IP address has been anonymized.
<29>Aug 21 15:01:32 openvpn[9739]: 1.2.3.4:39236 [name.surname] Peer Connection Initiated with [AF_INET]1.2.3.4:39236
The logs are already being pushed to the ELK stack, more specifically the logstash listener, which handles them, so we only need to write the appropriate logstash rules to parse the IP address and username out of the logs. We can use the grokdebug helper service to write the appropriate rule to parse the username and IP address from the log message.
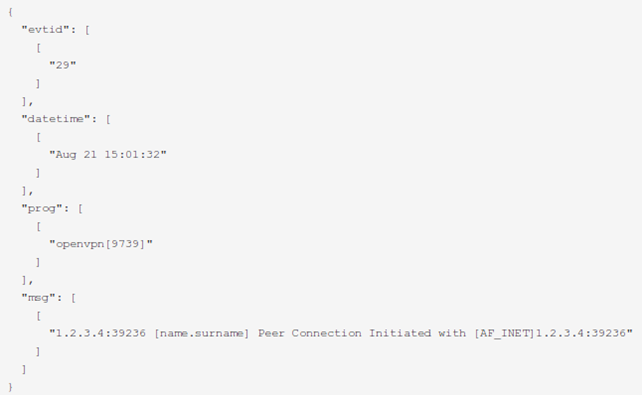
The first rule is shown below, which basically reads the event priority ID (the number at the start of the line enclosed with <>, the date and the program that generated the event.
match => [ "message", "<(?<evtid>.*)>(?<datetime>(?:Jan(?:uary)?|Feb(?:ruary)?|Mar(?:ch)?|Apr(?:il)?|May|Jun(?:e)?|Jul(?:y)?|Aug(?:ust)?|Sep(?:tember)?|Oct(?:ober)?|Nov(?:ember)?|Dec(?:ember)?)s+(?:(?:0[1-9])|(?:[12][0-9])|(?:3[01])|[1-9]) (?:2[0123]|[01]?[0-9]):(?:[0-5][0-9]):(?:[0-5][0-9])) (?<prog>.*?): (?<msg>.*)" ]
When the rule parses the above logs, it will parse the fields evtid, datetime, prog and msg as presented below. Did you notice that the remainder of the message was stored in the field msg and hasn't yet been parsed? This is because every program can generate a message with a different format, so we need to write multiple rules for every program.
Now that half of the log message has been processed, we have to write another rule to process the result of the message stored in msg to get the IP address and username. We can write a rule like below, which will
match => [ "message", "%{IP:vpnhost}:%{POSINT:vpnport} [%{USER:vpnuser}] Peer Connection Initiated with [AF_INET](?<hostport>.*)" ]
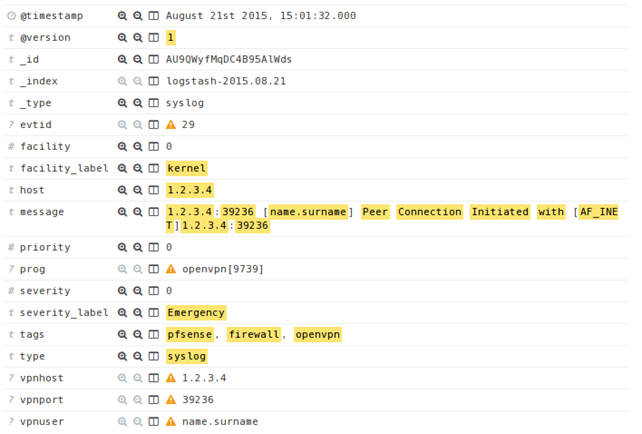
The result can be seen below, where the username is stored in vpnuser and the host in vpnhost. Back in Kibana interface, we can now see the following message, which has been appropriately parsed.
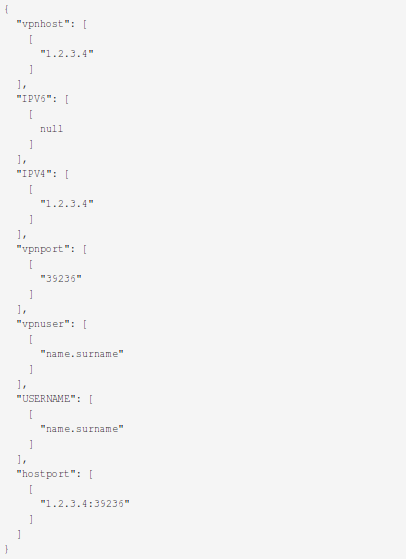
Back in the Kibana interface, we can now see the following message, which has been appropriately parsed as it contains the fields: vpnhost (the IP address of the remote user), vpnport (the PORT of the remote user) and vpnuser (the id of the authenticated user).
Now, we've done all the heavy lifting and we can start experimenting with the Kibana interface to create beautiful graphs outlining the parsed messages. In order to get a nice-looking graph with geographical information about the IP addresses, we can use geoip, which can be used to get physical location from an IP address to determine where OpenVPN clients are logging. When using a geoip database, there are a number of additional options stored to elasticsearch documents, the most important of them being the latitude and longitude.
At first, we have to download the GeoIP database by going into docker container by using docker exec and downloading the GeoLiteCity.dat database.
# cd /opt/logstash/# curl -O "http://geolite.maxmind.com/download/geoip/database/GeoLiteCity.dat.gz"
# gunzip GeoLiteCity.dat.gz
Afterwards, we have to add a geoip block into the logstash filter by specifying the database to point to the newly downloaded GeoLiteCity.dat database as well as source to specify the field containing the IP address. More specifically, we should add the following to the filter block where the OpenVPN messages are being parsed.
filter {
     geoip {
       source => "vpnhost"
       target => "geoip"
       database => "/opt/logstash/GeoLiteCity.dat"
     }
 }
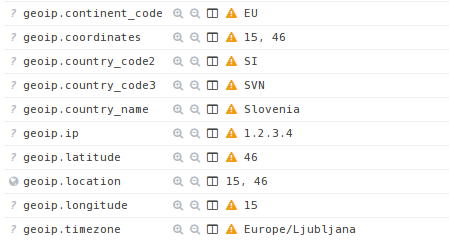
After restarting the logstash and obtainting a new OpenVPN log message, the message will also contain the following fields all starting with geoip, which contain the information about the geographical location of the IP from where the user is connecting.
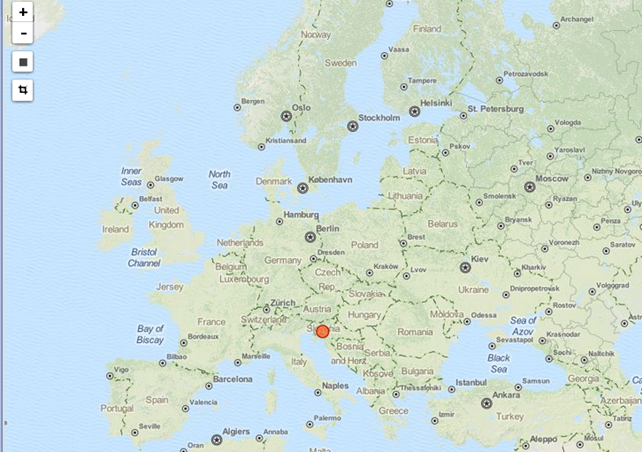
Then we can easily add a new map to Kibana web interface, which will show the IP from where the OpenVPN user connected. On the picture below, we can see the connection came from Slovenia, which is my home country.
Conclusion
Every system generates a number of logs at any given time in order to communicate that certain action was executed or certain problem needs to be addressed. It's often the case that system administrators don't pay any information to the system logs, so a system problem can go unnoticed for weeks or even months.
System logs are often used for security purposes as well, which is why sending logs to a central server is equally important to analyzing them to determine problems. The central location for storing all the logs is important, because an attacker having compromised a server can also tamper with the logs present on the server. By keeping the logs on a separate central server, the logs are easier to manage and especially analyze and the attacker doesn't have access to the log server, so the logs are secure, valid and can be used as a forensic evidence when a breach occurs.
In the old days, applications and daemons used to write .log files to the system to inform system administrators about a problem. There are a large number of log files all with its own custom log format, so managing them was hard and inefficient. This is why syslog was invented, which most of the applications and daemons use nowadays.
Learn Network Security Fundamentals
In the article, we've seen the advantages of keeping logs in a central place as well as looked at an actual example of parsing the log messages generated upon a successful OpenVPN connection, storing the IP address of a remote user and visualize it on a graph. Having done so, we can easily check whether a VPN connection came from a different country from where a user is located in which case we must investigate whether an actual existing user has connected to the VPN server.

CompTIA CySA+
Discover the latest salary trends for CompTIA CySA+ certified professionals in 2024. Learn what factors influence your earning potential in the cybersecurity field.

Cybercrime investigator
Cybercrime has hit record levels, with an expected $7 trillion USD to be made from cybercriminal activity by 2021. Investigating these sorts of crimes can be

EC-Council CEH
CEH v13 is the world's first AI-powered ethical hacking certification. Discover what's new, how it compares to v12/v11 and why it's a career game-changer.

CompTIA SecurityX
Explore the expert-level CompTIA SecurityX certification, what to expect on the exam, the career benefits and more.
