Implementation of a Virtual IDS Device in Passive Mode
The arrival of server, desktop and network virtualization has brought along enormous flexibility in configuration options and a huge drop in installation and operating costs of IT networks.
Due to this enhanced flexibility, the configuration of what was previously easy or at least well known, can now be a little more daunting.
Learn Network Security Fundamentals
An Intrusion detection or prevention device (IDS / IPS) for instance, used to be connected either inline or via a span port with physical cables. This can still be done for a hardware based IDS / IPS, but it can also be done completely inside a virtual environment, without even touching a cable.
The following example will cover the configuration of a Snort-based IDS, which will be monitoring an active, promiscuous virtual switch in Tap mode. All this will be running inside a single VMWare ESXi host, but it can be easily adjusted for Microsoft Hyper-V or any other Hypervisor as well.
Installation of Debian with Snort.
In this example, a Debian v8.3 64-bit OS was installed as a virtual host. There are some key requirements to operate this future IDS in Tap mode (where it sits on the side of the network and only monitors and alerts) inside a virtual environment. Within the Hypervisor, the following configuration is required:
-
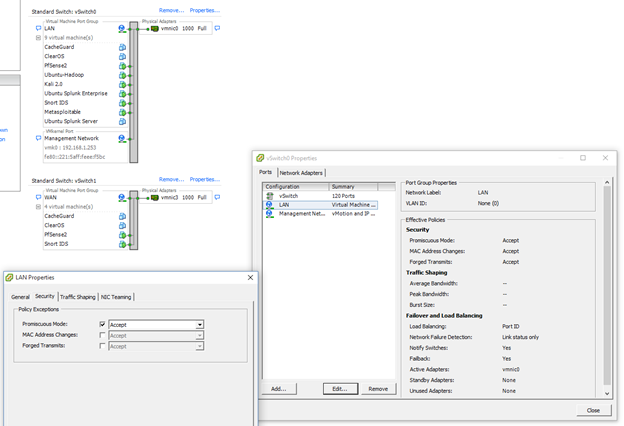
2 Virtual Switches, 1 for LAN and 1 for WAN traffic.
The LAN virtual switch will connect all internal traffic between virtual hosts and to and from physical NICs assigned to it. The WAN Virtual Switch connects to the proxy or router in this example. Other configurations such as an IDS on the perimeter are also possible and only require some tweaking of the switch placement.
- Set one or both Virtual switch security settings to accept "Promiscuous mode," depending on which traffic is of interest. This will allow the IDS to listen to all traffic traversing that switch. The switch can be broken up into several virtual switch ports as well if more granularity is required.
-
A minimum of 2 NIC's on the new IDS host:
- 1 NIC connected to the LAN virtual switch
- 1 NIC connected to the WAN virtual switch
- (Tip: the MAC address of the NICs will identify which NIC should be assigned which internal or external IP address during the OS installation later)
Debian v8.3 64-bit NetInstall (minimum initial download, requirements will be downloaded during installation) can be obtained here.
Once the OS has been installed, the inline Snort installation procedure, which also works well for the 2 NIC Tap mode, can be found here.

Snort in Tap (passive) mode.
Snort can operate in 2 modes: Inline and Tap mode. Inline mode means Snort is connected between 2 or more network segments, each connected to a separate NIC. This will allow Snort to not only monitor but also block traffic flowing between these network segments when a signature is triggered. This blocking can create issues with False Positive alerts, and the inline operation can slow down traffic as well. Tap mode is much safer for production traffic, but blocking is not an option here. Snort has some options to block traffic via the "knock down" of traffic using RST segments for TCP traffic or ICMP error messages for UDP traffic, but this is far less powerful than blocking in inline mode.
In this example configuration, Tap mode was chosen. The high network performance was more important than the blocking options. There is a lot of available documentation covering inline mode, a more common setup, as well.
The main Configuration of Snort is done via the snort.conf file. The configuration manual can be found here.
Testing Snort with a custom ping rule.
Once the Snort IDS sensor has been installed, it can be tested via a simple, custom ICMP rule. This rule will fire on any detected ping traffic which makes it very easy to trigger. The rule should be stored in local.rules and this local.rules file should be listed in the enabled snort.conf rule files.
#alert icmp any any -> any any (msg:"ICMP test local"; classtype:bad-unknown; sid:10000016; rev:1;)
#alert tcp any any -> any any (msg: "SQL Injection test rule"; content: "sqli"; http_method; nocase; classtype:web-application-attack; sid:30000001; rev:1;)
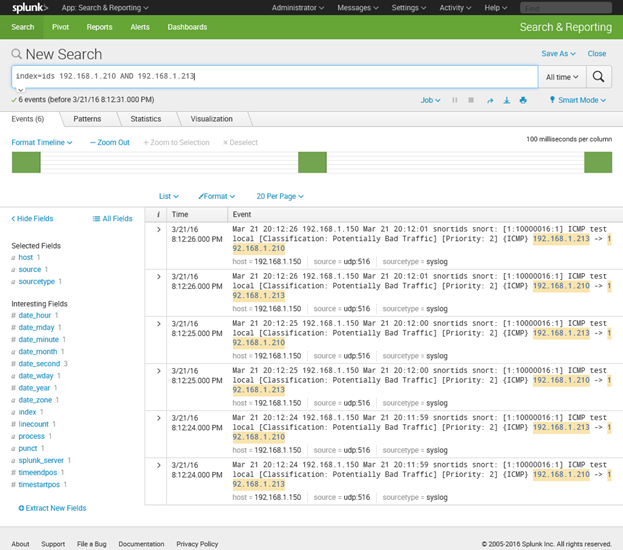
Now simply Ping anything to and from the networks monitored by Snort and look at the Snort screen output or configured local log files for the alert.

External Logging via Rsyslog.
When Snort is working, the test rule is firing, and the local configuration is completed, it is worth configuring a remote logging option for further analysis. Snort will generate a large amount of data, and some automated analysis is required to cover every potential security issue. The example setup will feed the Snort IDS logs into a Splunk server via Rsyslog. Any other Log Server or even a SIEM solution would work with rsyslog as well.
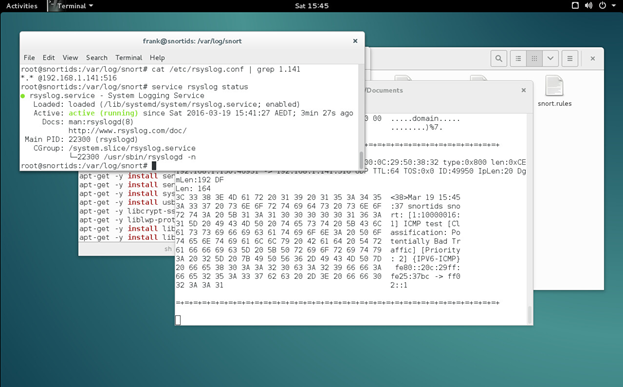
Rsyslog needs to be installed first, and an entry should be added to the /etc/rsyslog.d configuration file, which will look something like: *.* @192.168.1.141:514 depending on the network configuration.
This entry should point at the remote syslog server and the *.* means it covers all log data.
Once that has been done, the Rsyslog service will need to be restarted.

Log data feed to Splunk.
An example of a Log server is Splunk (of course there are many other options as well). A Syslog-based Splunk Listener can be setup on the same port as was configured in the Snort server Rsyslog.conf file. Once this is all completed, the Snort alerts will flow into the selected Snort instance. These alerts can be triggered as well for further testing. It is easy to install a Virtual Kali machine on the ESXi host, connected to the monitored switch. The Kali system can be used to "attack" anything on the network. As long as the content of the traffic matches one of the enabled Snort rules, the alerts will show up in the Splunk index.

Learn Network Security Fundamentals
The configuration of this Snort IDS device within the ESXi virtual environment is based on a small-scale test lab. All configured components, however, are easily scalable to much higher standards and specifications. The ESXi server can be in a farm for instance. There can be multiple Snort IDS devices, possibly each covering their network segments. The capabilities of Splunk Enterprise are enormous, and a SIEM solution can easily be linked as well, via Rsyslog. It is important to see the structure of this configuration itself. The building blocks will all be the same and due to the virtualization that was used, the flexibility is limitless.


