How to use MITRE ATT&CK Navigator: A step-by-step guide
Sorting through information can be a difficult task at the best of times. When you are dealing with a literal mountain of actionable data like the MITRE ATT&CK Knowledge Base, just picking a starting point can be a tough job. Fortunately, MITRE has created the MITRE ATT&CK Navigator— a tool for searching across the entire KB and bringing together particular attack types and custom notations for organizations.
Accessing MITRE ATT&CK Navigator
To get to the MITRE ATT&CK Navigator, we will first want to access their GitHub at https://github.com/mitre-attack/attack-navigator/. This allows us to use the tool multiple ways, such as using a hosted version at https://mitre-attack.github.io/attack-navigator/, or we can download the files ourselves and use it locally. [CLICK IMAGES TO ENLARGE]
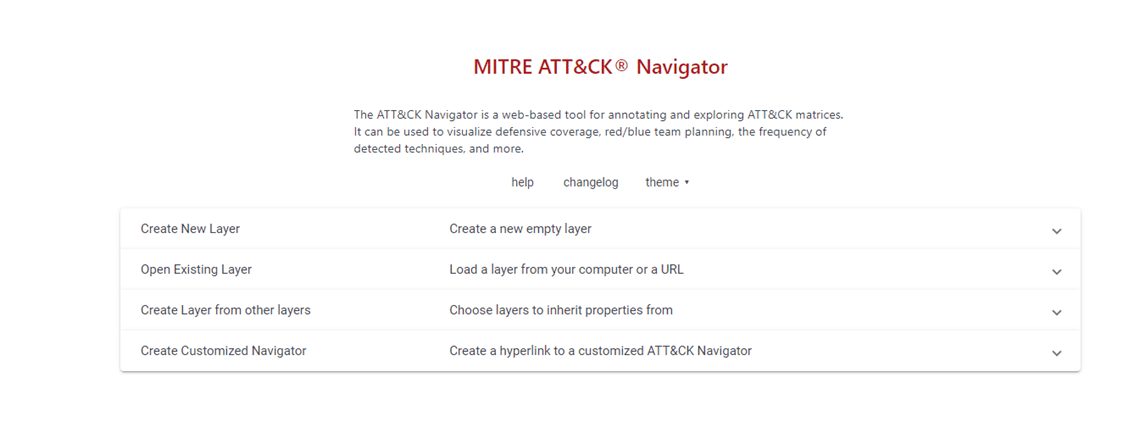
In either scenario, when we open up the navigator, we are greeted with a menu, asking what we want to do. For our purposes today, we will be making everything new, so we will first want to click on 'Create New Layer' and select 'Enterprise' when the new dropdown menu appears.
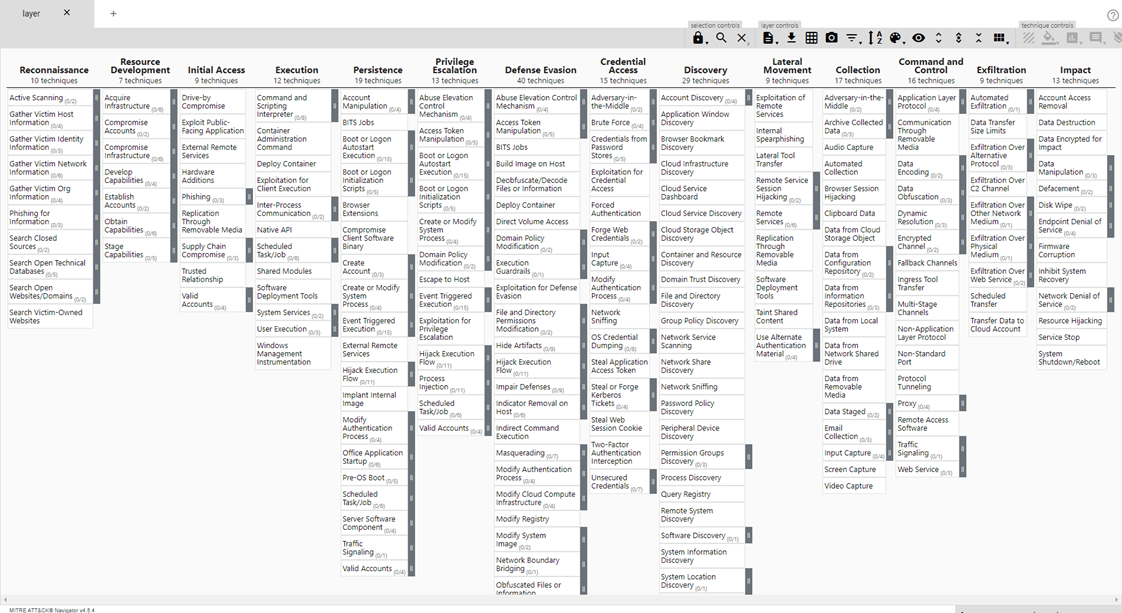
As you can see, the MITRE ATT&CK KB covers a lot of data. Fortunately, we can use some of the built-in tools to narrow down our search for what we need at this particular moment.
Searching for specific elements
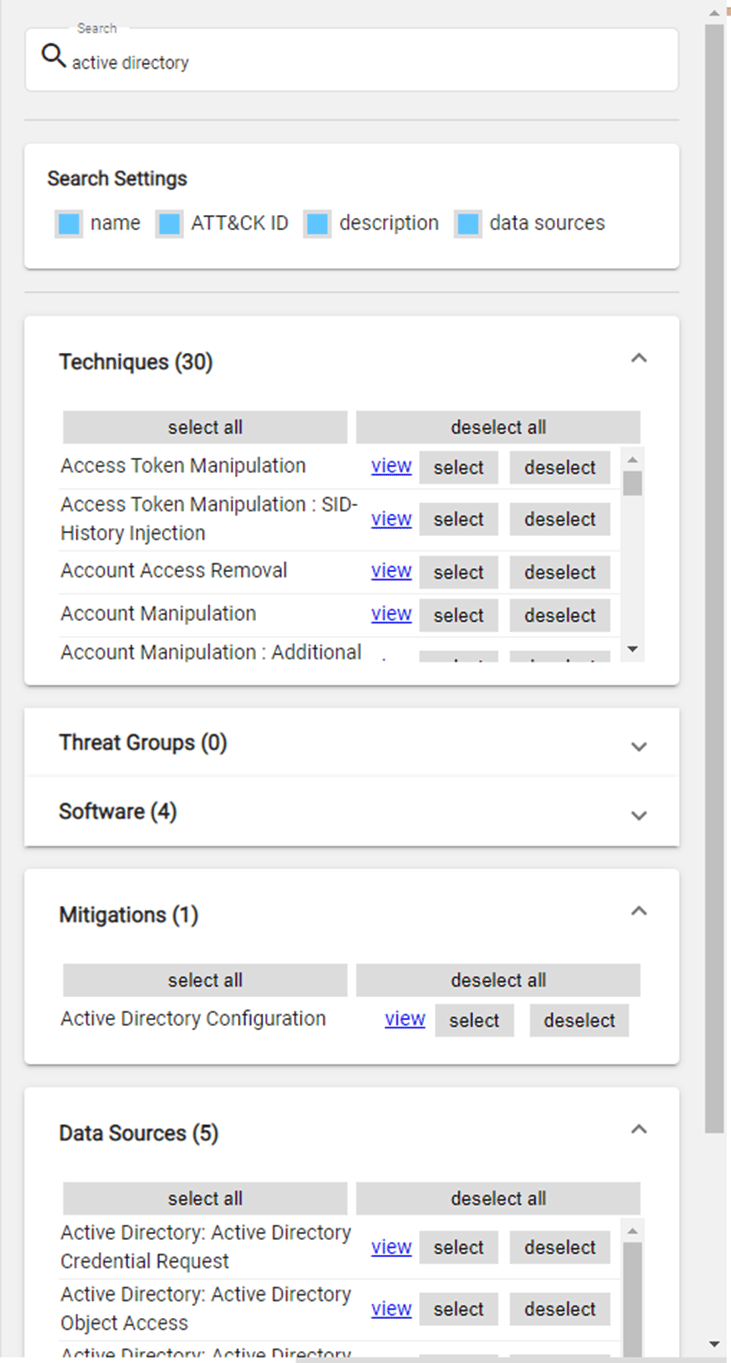
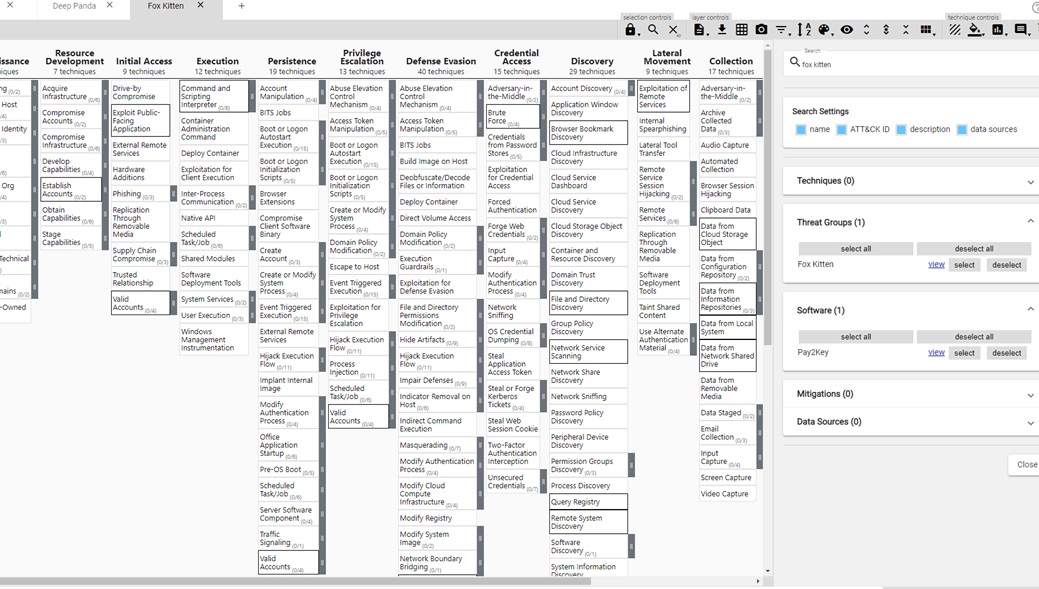
We'll want to click on the magnifying glass icon on the toolbar to start our search. This allows us to search across multiple categories simultaneously, depending on exactly what we are trying to find. Say, for example, we wanted to find issues affecting Active Directory. Once we enter our search, the view populates quickly with articles for us to check out.
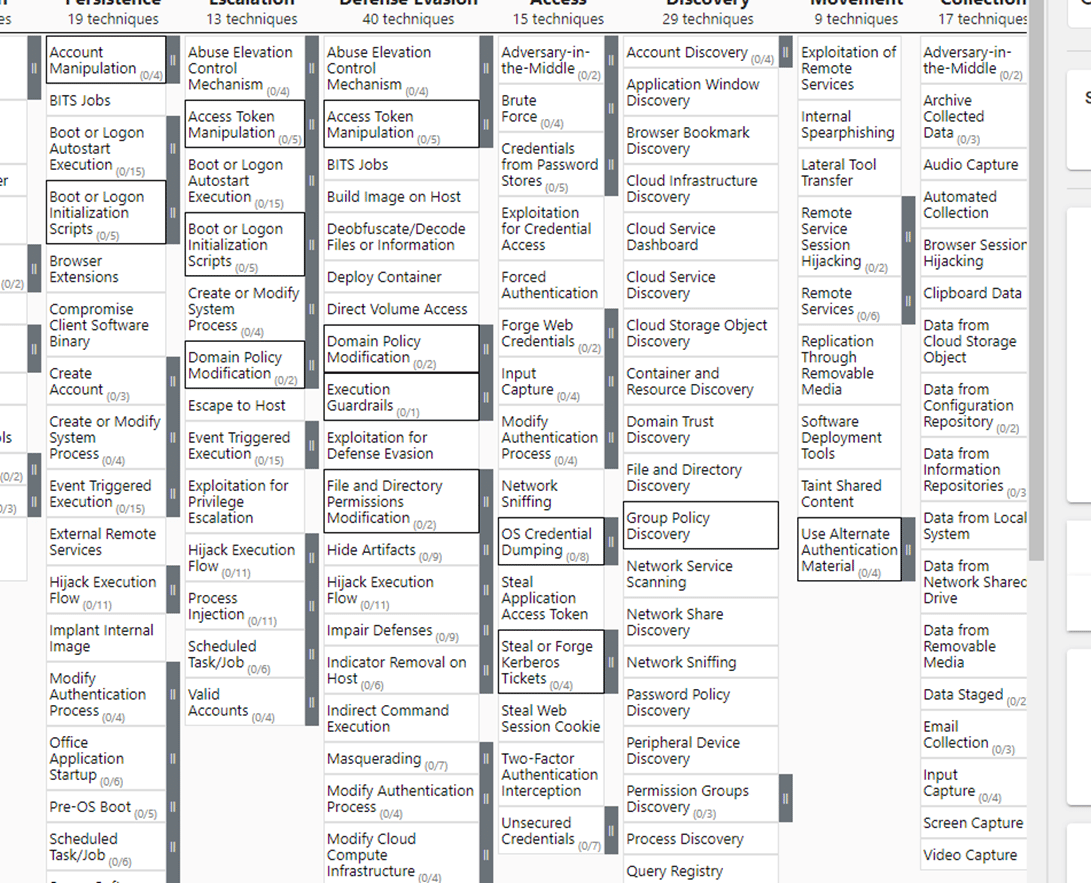
This does not really change an actual regular search function that much until this moment. However, what it does give us is the ability to 'select' particular elements. Under the 'Techniques' category, if we click on the 'Select all' button, we immediately see several boxes appear on the main window.
If we wave over these boxes, we can see that each of them references a particular article and can give us an idea of just how many different techniques will need to be checked out. The display of this information in this format is what the navigator calls a 'layer.'
Layers: They're not just for image editing
Suppose you've ever used image editing/manipulation programs such as Photoshop. In that case, you'll be familiar with the concept of layers — specifically, bits of an image that can be stacked on top of one another to create a different result but does not impact any of the data underneath it. In this way, it is possible to completely alter an image in an instant instead of completely reworking it.
Layers in the navigator can work in similar ways. We can use the navigator to showcase the techniques they each use and which ones they both share, thus prioritizing those shared techniques to maximize productivity. For example, say that we had heard about a new APT group active on the scene, but we were still deep in mitigating attacks from a different APT group.
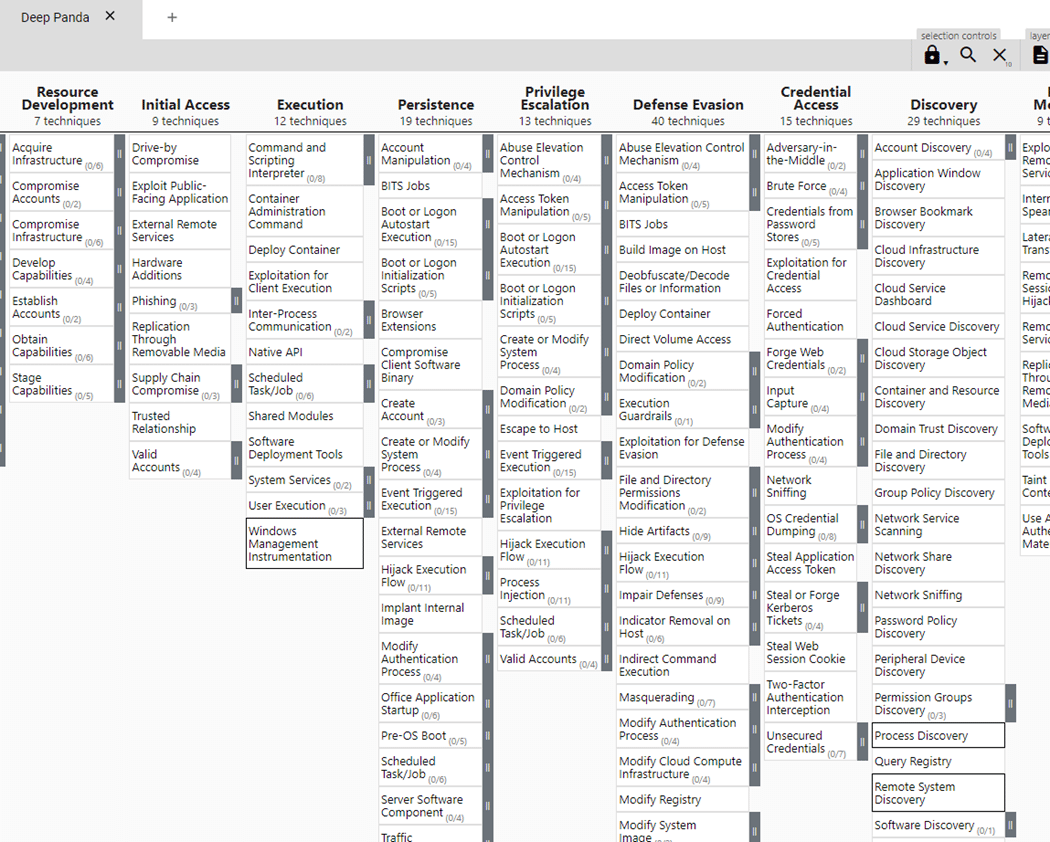
Since we want to keep this data as readable as possible, we can name our layers and add descriptions to make them more human-trackable. To do this, we can click on the '+' sign at the top to create a new layer in the same way we did before. If we click on the layer1 tab, a screen will appear to allow us to enter this information, so let's call it 'Deep Panda.' We can then run our search for 'Deep Panda' and select it as we did before.
In the upper right corner of the screen, we'll want to click on the 'scoring' button and assign the values associated with 'Deep Panda' a score of 1.
Now let's create a new layer again, but this time we'll add in data for the group 'Fox Kitten' and assign them a score of 2.
After we have our two layers, we can create a layer that will allow us to combine and compare their data.
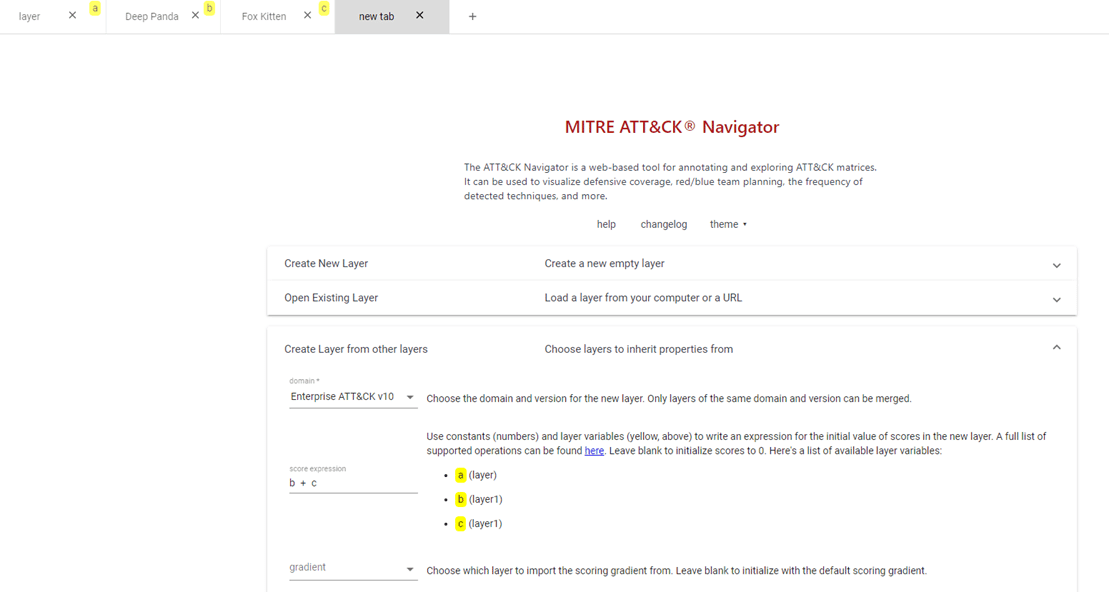
We will want to select the 'Create Layer from other layers' function now and tell which layers we want to reference. At the top of the screen, we will see small yellow boxes telling us what each layer is referred to as internally by the navigator. We can then enter this information in the 'Score Expression' field, adding on each layer to compare. Once this is done, we'll be brought to the new layer screen.
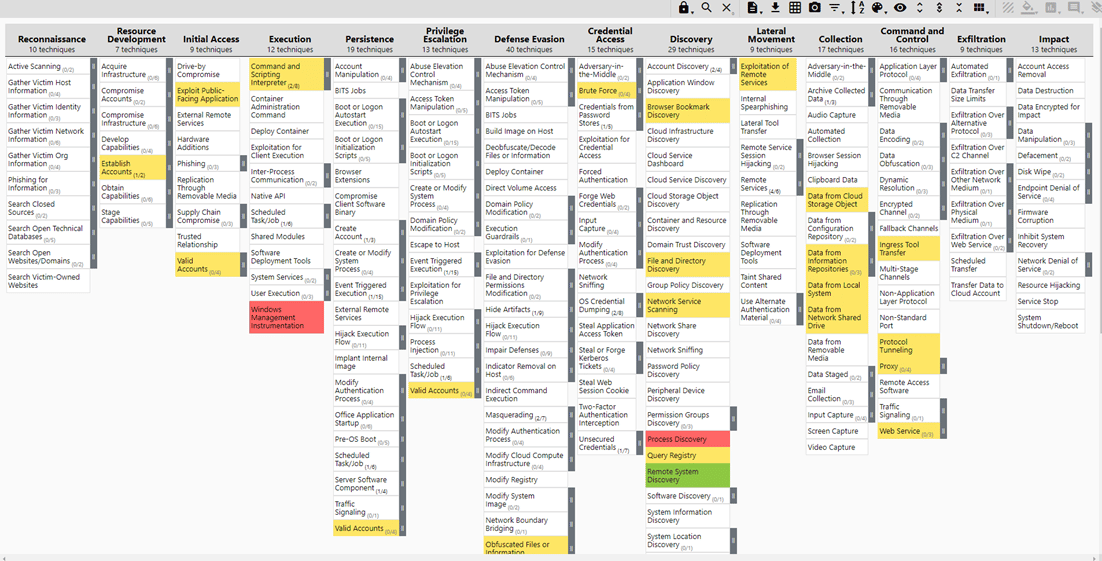
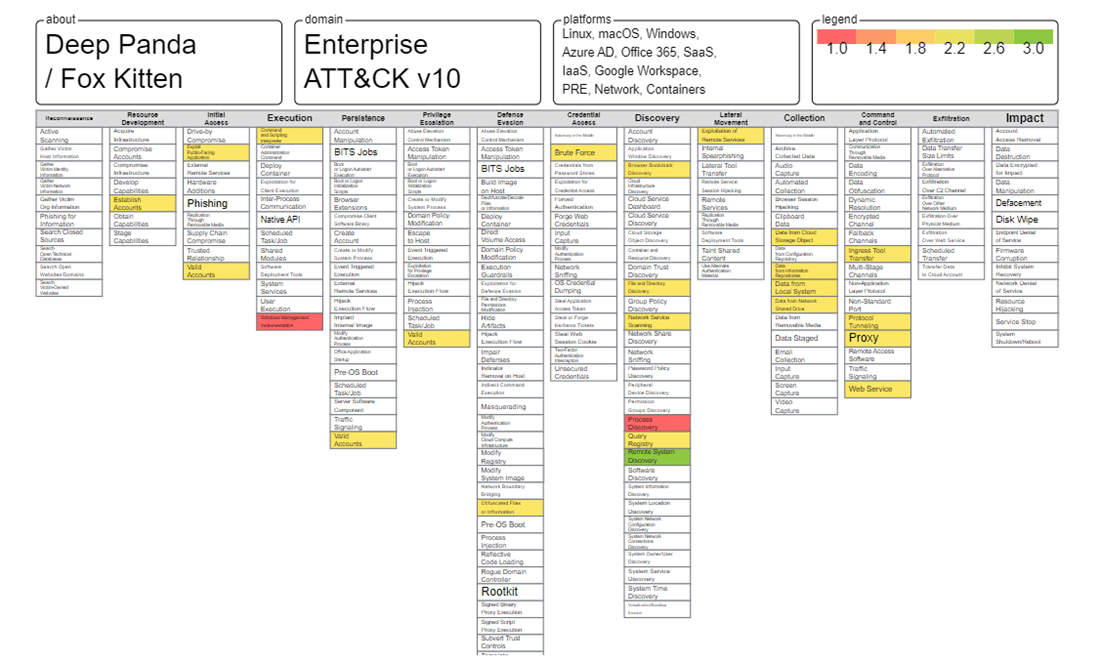
Finally, we will want to click on the 'color setup' button and set our 'high value' here to 3. This will effectively add together any areas where both groups exist (Panda = 1, Fox = 2, so areas where 1 + 2 both exist, will equal 3).
This means that Remote System Discovery will be our top priority for being able to mitigate both groups at once.
Downloading Data
Despite the fact that this is a very good worksheet for analyzing information, we will eventually have to present data to other people, which means getting it out of just a browser interface. Fortunately, they have built-in functions to export out data in json, svg, and Excel file formats. If we export out to svg for example, we end up with something like this:
MITRE ATT&CK Navigator
The MITRE ATT&CK Navigator can be a tremendous asset in narrowing down what actions we immediately have to take and allowing us to present information in an easy-to-follow format. It does not follow through on those actions any easier, so it will be up to our teams and us to make the most of what this shows us.
Sources:
- https://www.youtube.com/watch?v=78RIsFqo9pM How to use the MITRE ATT&CK Navigator
- https://www.youtube.com/watch?v=pcclNdwG8Vs Introduction to ATT&CK Navigator
- https://attack.mitre.org/ MITRE ATT&CK Knowledge Base

