IOS Application Security Part 15 - Static Analysis of IOS Applications using iNalyzer
In the previous article, we looked at how we can use Sogeti Data protection tools to boot an iDevice using a custom ramdisk with the help of a bootrom exploit. In this article, we will look at a tool named iNalyzer than we can use for black box assessment of IOS applications. iNalyzer allows us to view the class information, perform runtime analysis and many other things. Basically it automates the efforts of decrypting the application, dumping class information and presents it in a much more presentable way. We can also hook into a running process just like Cycript and invoke methods during runtime. iNalyzer is developed and maintained by AppSec Labs and its offical page can be found here. iNalyzer is also made available open source and its github page can be found here.
iNalyzer require some dependencies to be installed before use. Please make sure to install Graphviz and Doxygen as iNalyzer won't function without these. Also, please note that while performing my tests on a Mac OS X Mountain Lion 10.8.4, i had problems with the latest version of Graphviz and it used to hang every time. Hence i downloaded an older version of Graphviz (v 2.30.1) and it worked fine for me. You can find older versions of Graphviz for Mac OS here.

11 courses, 8+ hours of training
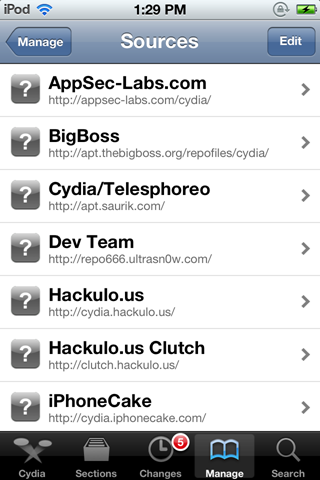
The first step is to install iNalyzer on your jailbroken iDevice. To do that, go to Cydia --> Manage and make sure the source http://appsec-labs.com/cydia/ is added as shown in the image below.
Then go to Search and search for iNalyzer. Depending on the IOS version that you are running, you should download the corresponding version of iNalyzer.
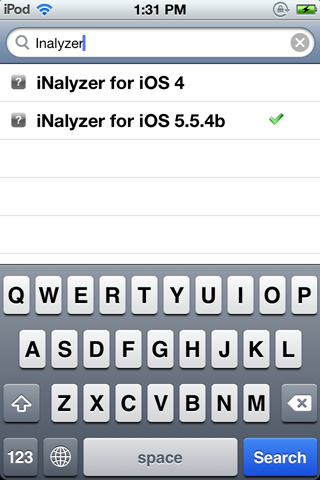
As you can see, i have already installed iNalyzer.
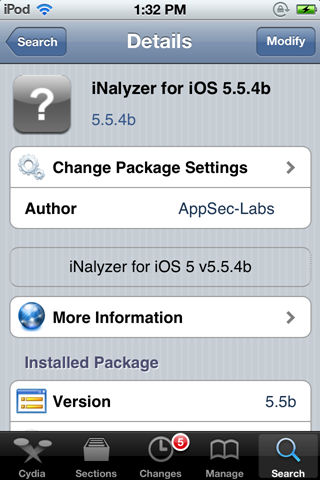
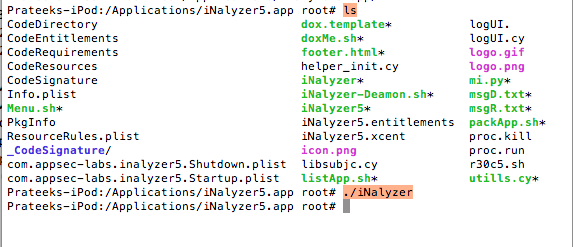
Now ssh into the device and navigate inside the iNalyzer application directory. iNalyzer is installed in the /Applications directory because it needs to run as a root user. If you don't understand this concept, please make sure to read the previous articles in this series.

Run ./iNalyzer to start iNalyzer.
Now if you go to your homescreen and look at the iNalyzer app icon, you will see a badge icon number on top of it. This indicates that the app can be remotely accessed via a web interface and the port number is the badge icon number represented here. If you run ./iNalyzer again, it will stop iNalyzer. Hence, make sure to remember that running ./iNalyzer starts and closes the application alternatively.
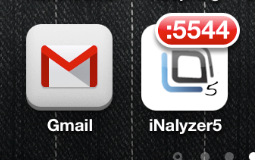
Now find the ip address of your iDevice and open the url ip:port from your browser. In my case the port number is 5544 and the ip address of the device is 10.0.1.23 . Hence the url is http://10.0.1.23:5544/ . Once you go there, you will be presented with an interface as shown in the figure below. You can then select an application and iNalyzer will prepare a zip file and download it on your system for analysis.
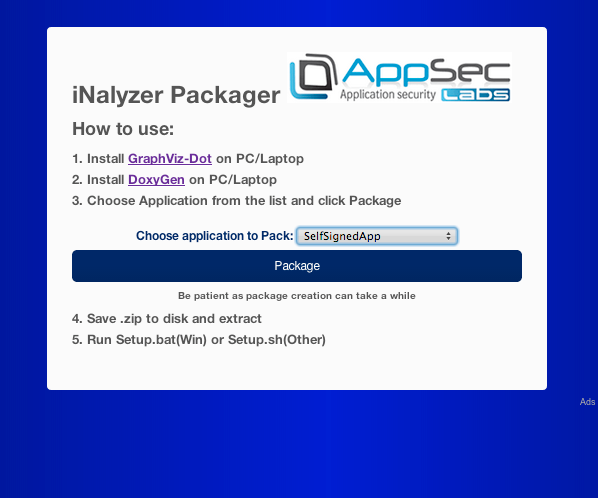
However, i had some problems while performing this. Hence, we will also be looking at an alternative solution to do the same step. To do that, first of all make sure iNalyzer is running. Then navigate inside the iNalyzer directory and run iNalyzer5 without any arguments.

You will see all the list of apps available for analysis. In this case, let's select the Defcon App for analysis.
[caption id="" align="alignnone" width="623"] Click to Enlarge[/caption]
You will see that iNalyzer begins its work. It decrypts the app, finds out the class information and other things. As you can see from the figure below, once iNalyzer has finished its job, it will create an ipa file and store it at the location as highlighted in the image below.
[caption id="" align="alignnone" width="618"] Click to Enlarge[/caption]
So now we need to get this ipa file and download it on our system. We can do that via sftp.
[caption id="" align="alignnone" width="624"] Click to Enlarge[/caption]
Once we have the ipa file, change its extension to zip. Then unzip the file.
[caption id="" align="alignnone" width="619"] Click to Enlarge[/caption]
Now with a terminal, navigate inside the folder Payload-->Doxygen.
[caption id="" align="alignnone" width="623"] Click to Enlarge[/caption]
You will see a shell script named doxMe.sh. If you look inside it, you will notice that it automates the task of running Doxygen for us. Doxygen also runs Graphviz for generating graphs and the results are stored inside a folder with the name html. Basically, iNalyzer has already stored all the class information for us inside a folder named Reversing Files and it uses Doxygen and Graphviz to display the information in a much more presentable format.This shell script also opens up the index.html file inside the created html folder.
[caption id="" align="alignnone" width="620"] Click to Enlarge[/caption]
So lets run this shell script and let iNalyzer do all the things for us.
[caption id="" align="alignnone" width="620"]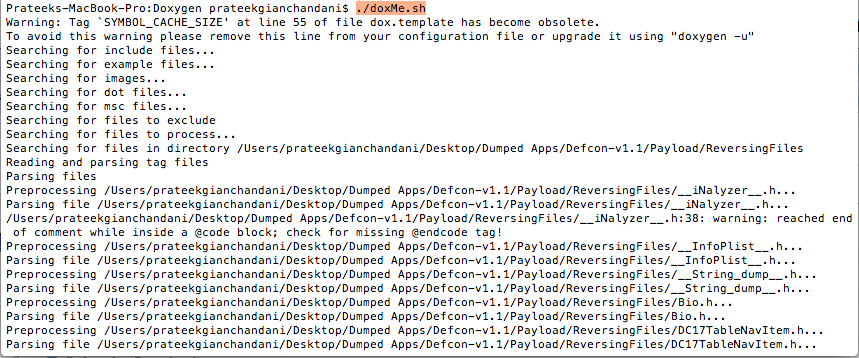 Click to Enlarge[/caption]
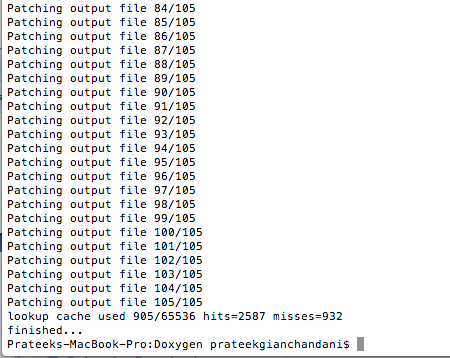
Once this is done, iNalyzer will automatically open up the index.html file stored inside the html folder that was created. Here is what it looks like. In this case, i am using chrome. However, the developer of this tool personally recommended me to use firefox browser for runtime analysis as the other browsers may be buggy. As you can see from the image below, the first page gives a strings analysis of the entire app. It divides the strings into SQL and URL strings.
[caption id="" align="alignnone" width="621"]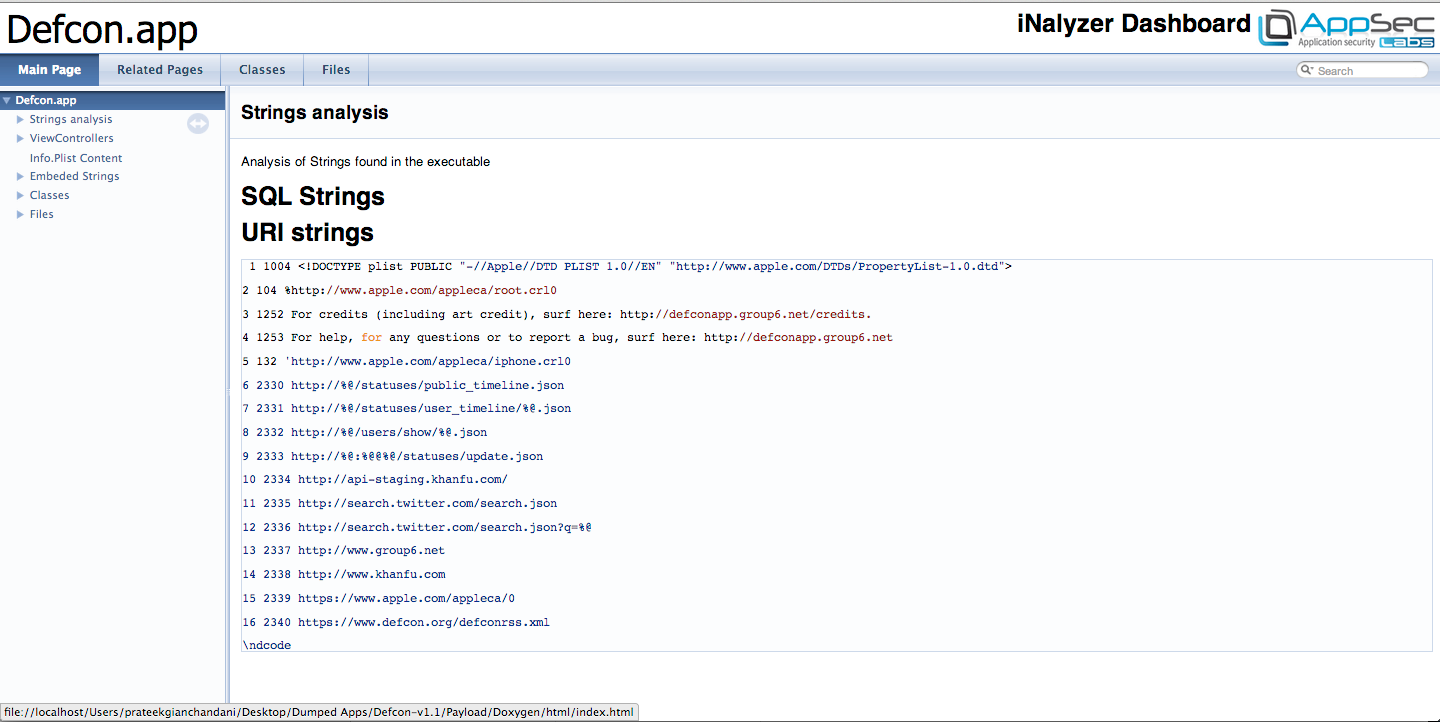 Click to Enlarge[/caption]
You can also have a look at all the view controller classes used in the app.
[caption id="" align="alignnone" width="620"]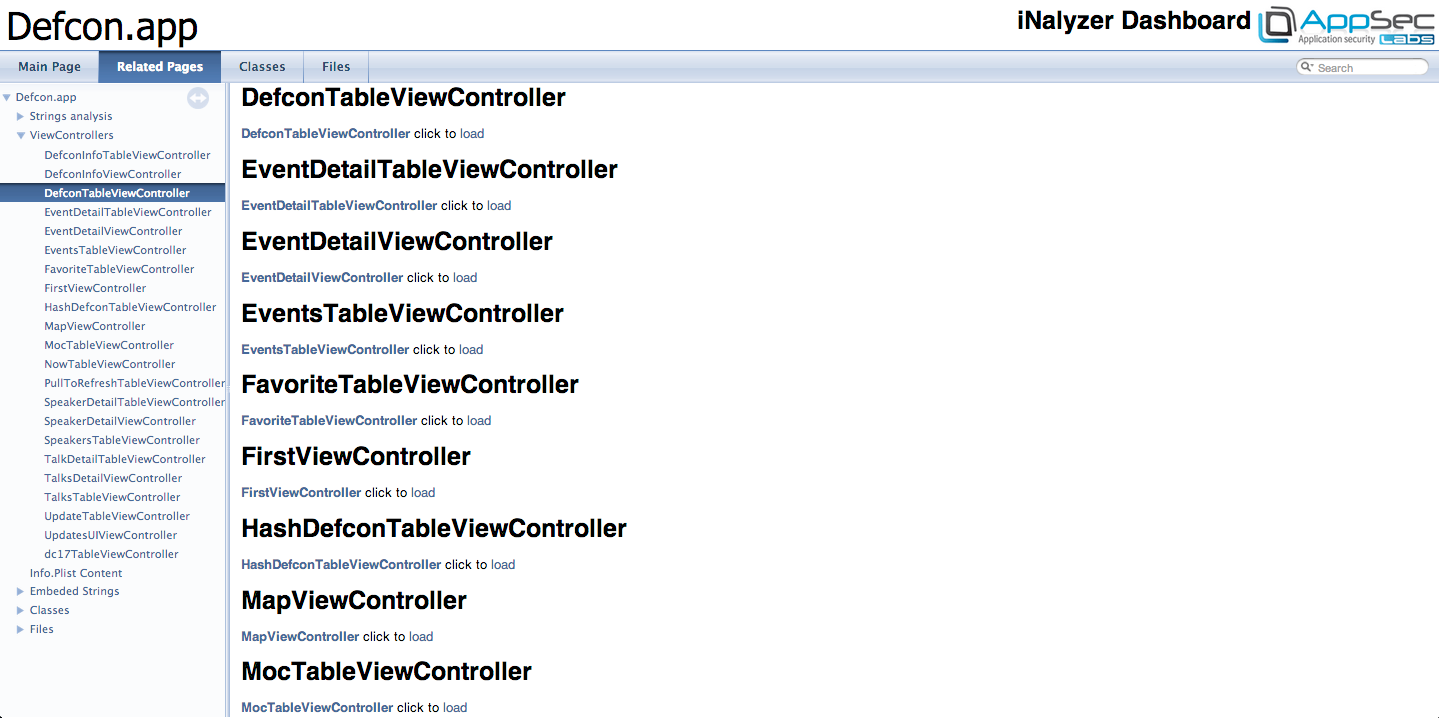 Click to Enlarge[/caption]
Tapping on any of the view controllers will show you its methods and properties.
[caption id="" align="alignnone" width="621"]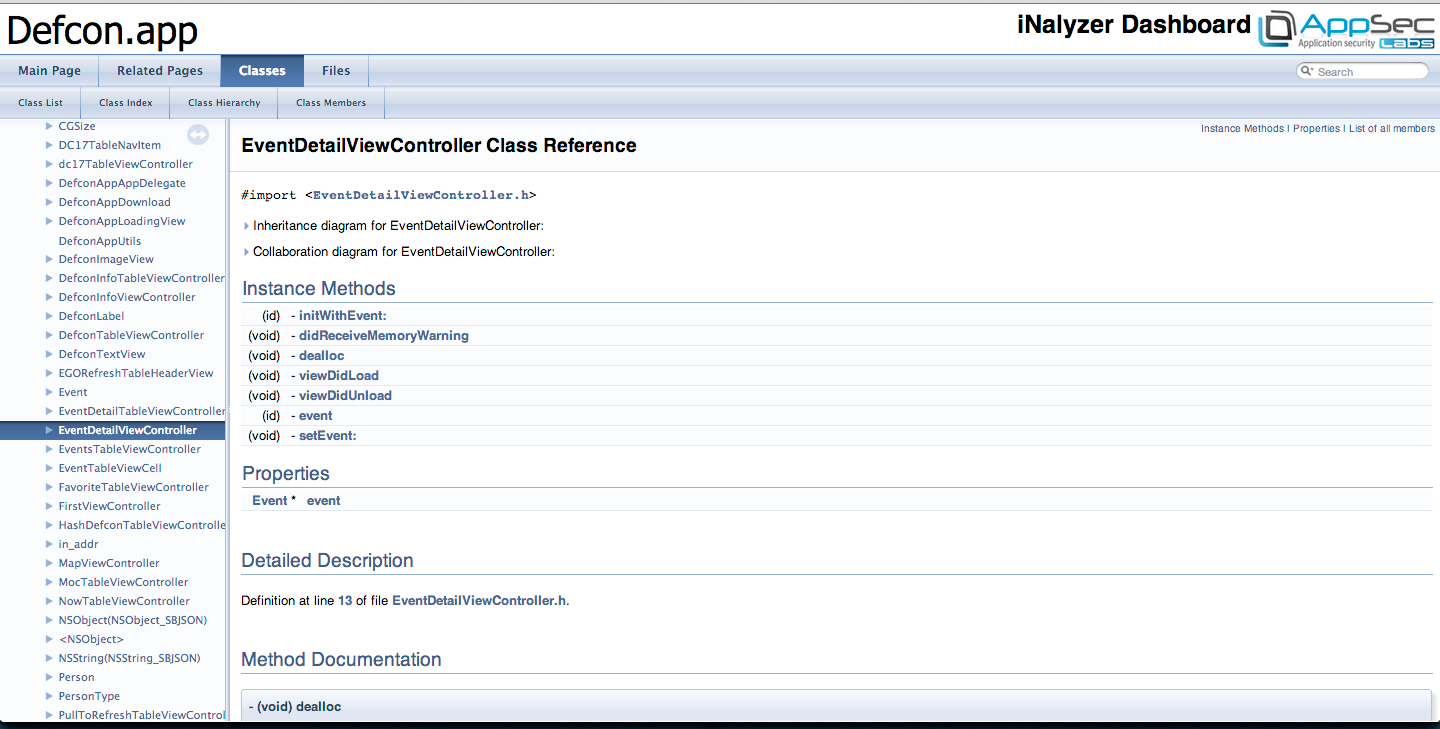 Click to Enlarge[/caption]
You can also look at the contents of the Info.plist file.
[caption id="" align="alignnone" width="621"]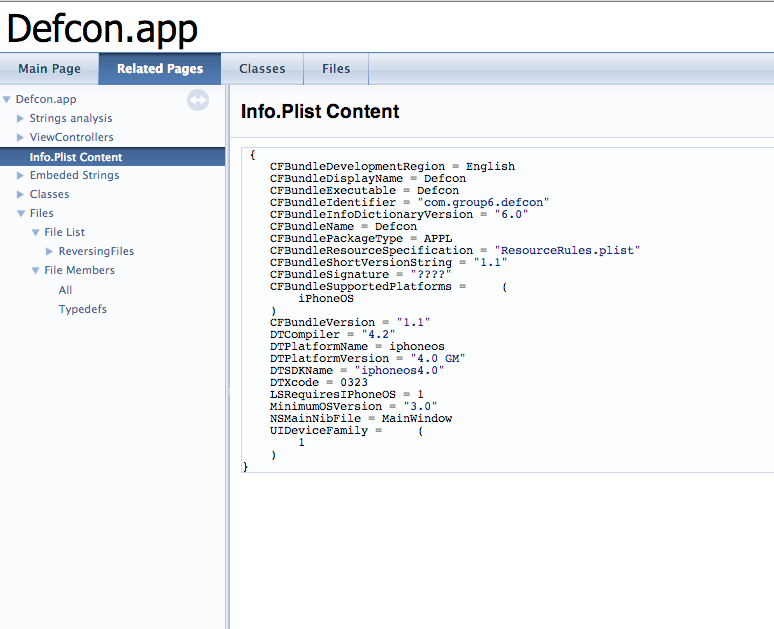 Click to Enlarge[/caption]
If you go under the Classes Tab and under Class Index you will see a list of all the classes being used in the app. Some of them are Apple's own classes while some are created by the developer of this app.
[caption id="" align="alignnone" width="621"]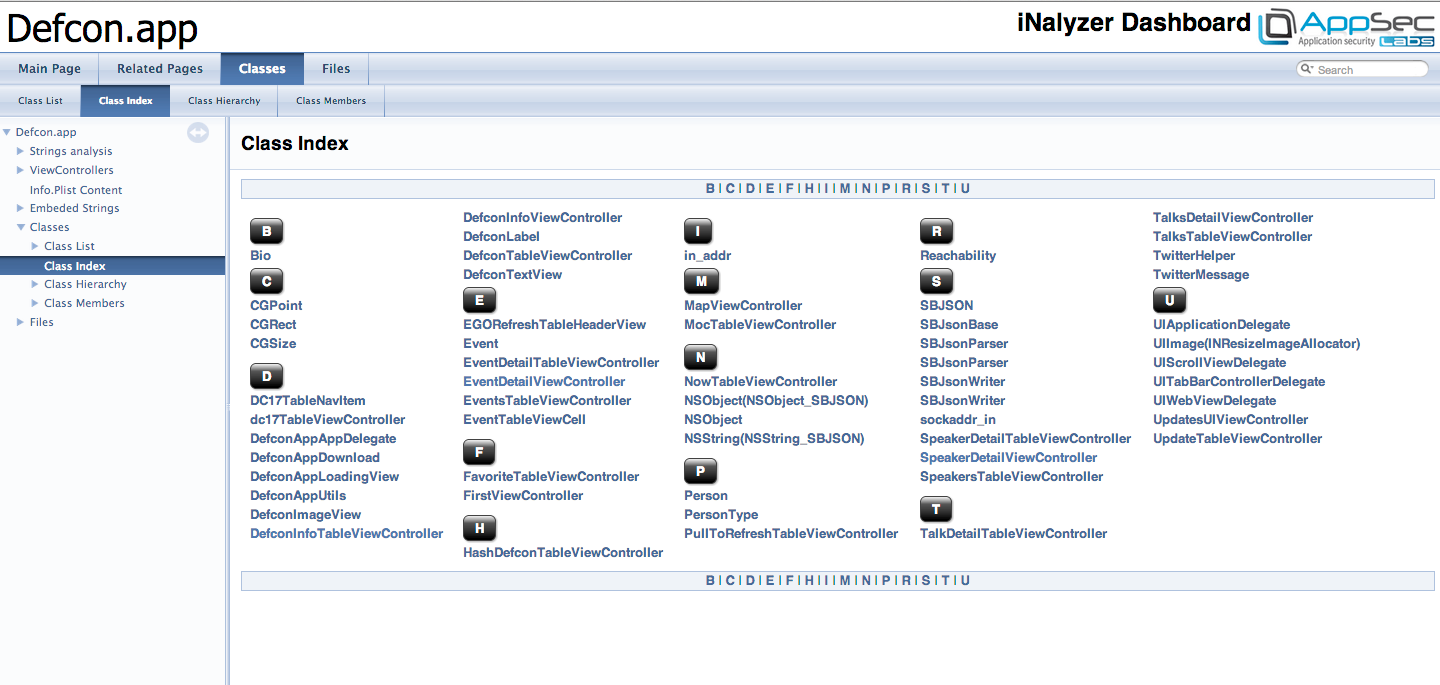 Click to Enlarge[/caption]
If you go under the Class Hierarchy tab, you will see the class information and relationships being represented in a graphical format. This gives us a fair amount of knowledge on how this application works. These graphs are generated by the Graphviz tool.
[caption id="" align="alignnone" width="620"]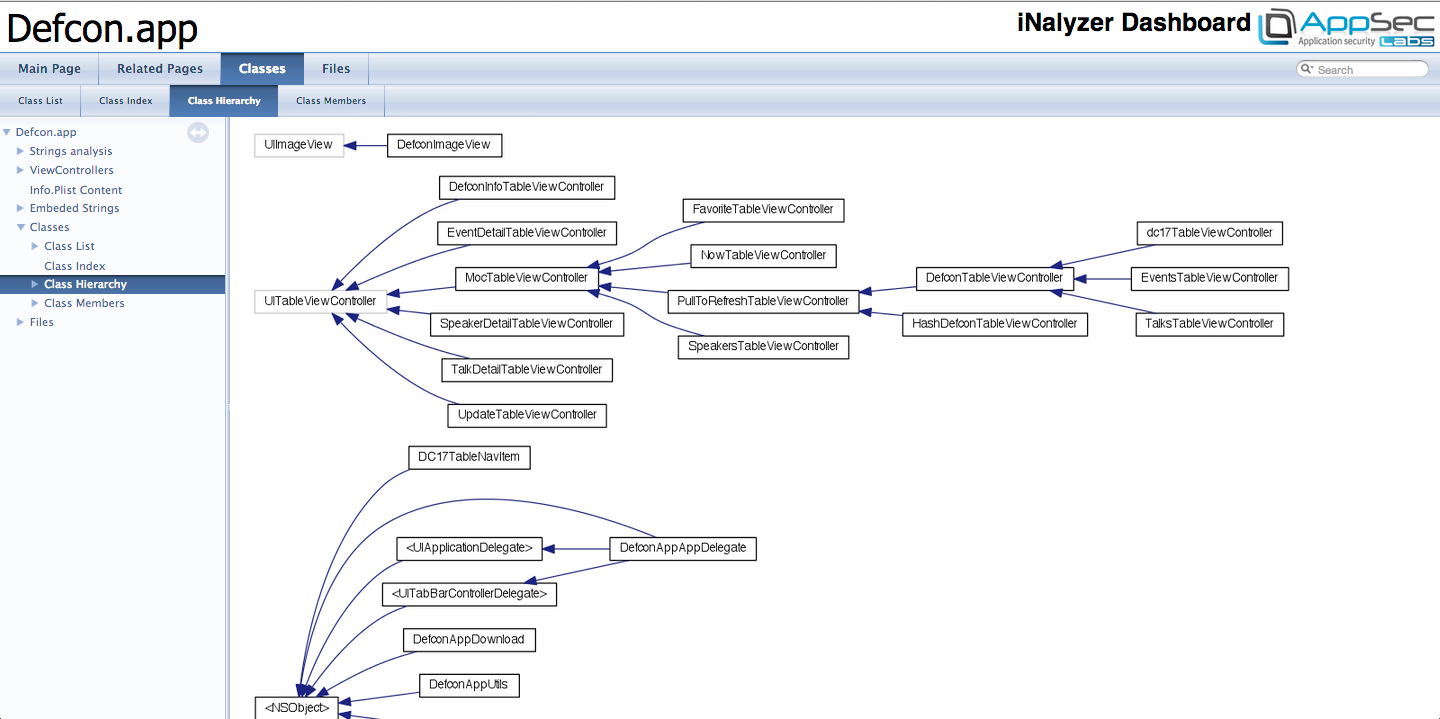 Click to Enlarge[/caption]
If you go to the files tab, you can have a look at all the interface files that iNalyzer generated.
[caption id="" align="alignnone" width="619"]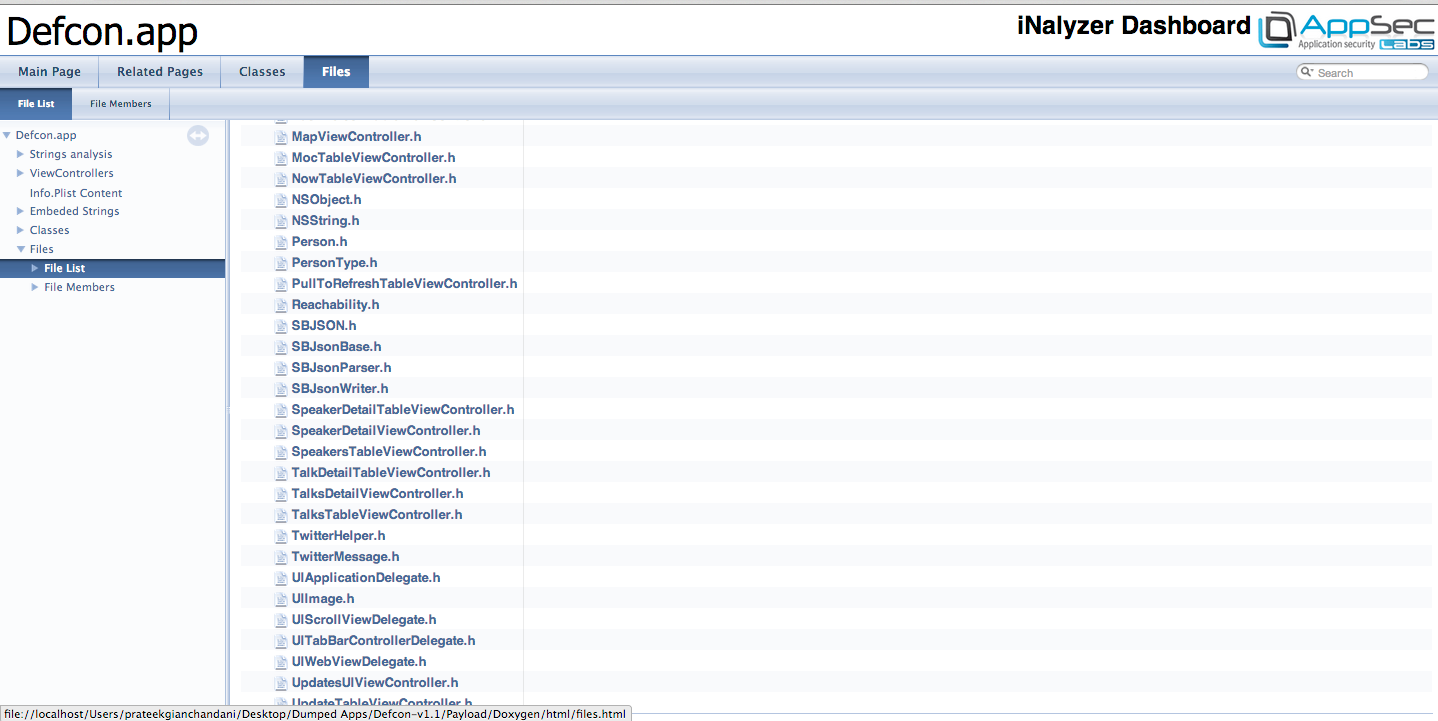 Click to Enlarge[/caption]
Conclusion
In this article, we looked at static analysis of IOS applications using iNalyzer and how easy it makes our job. In the next article, we will look at how we can use iNalyzer further for runtime analysis of IOS applications.
References
- iNalyzer


