Exploiting debuggable android applications
In the previous article, we have seen how to debug Java applications using a little tool called JDB. In this article, we will apply the same logic to exploit Android apps, if they are flagged as debuggable. If an application is flagged as debuggable, we can inject our own code to execute it in the context of the vulnerable application process.
To make this article more interesting, I have developed a vulnerable application for demonstration purposes, which has a "button" and a "textview".
Fill out the form below to download the code associated with this article.
If we launch the application, it shows the message "Crack Me".

Figure 1
If we click the button, it says "Try Again". Now, our goal is to change the message "Try Again" to "Hacked" without modifying the application's source code. To be precise, we have to change it at runtime.
Required tools
- Emulator
- adb - Android Debug Bridge
- jdb - Java Debugger
In my case, to make the installations easier, I am using Android Tamer since all the above required tools are pre-installed.
Topics Involved
- Checking for Vulnerability.
- Getting Ready with the Setup.
- Runtime Code Injection.
Let's begin the game.
Checking for vulnerability
In fact, this is the easiest part of the entire article.
- Decompile the application using APKTOOL to get the AndroidManifest.xml file using the following command.
apktool d <vulnerableapp>.apk
- Inspect Androidmanifest.xml file for the following line.
android_debuggable="true"
If you find the above line in the AndroidManifest.xml file, the application is debuggable and it can be exploited.
Note: We used APKTOOL to see whether the app is debuggable or not. We won't touch or modify any piece of code as mentioned earlier.
Getting ready with the setup
In this step, we will set up all the required things to inject code in to the app during its execution. As mentioned in the previous article, we will use remote debugging in this article.
- Start Your Emulator
- Install the vulnerable application
- Open up your terminal and run the following command to see the Dalvik VM ports listening on the emulator.
adb jdwp
The above command displays all the ports on which we can connect and debug as shown below.
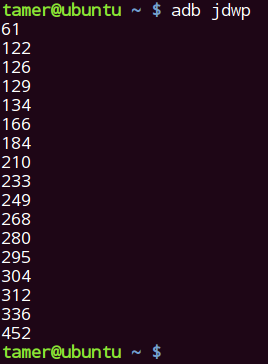
Figure 2
Note: JDWP stands for Java Debug Wire Protocol. If an application running in its VM is debuggable, it exposes a unique port on which we can connect to it using JDB. This is possible in Dalvik Virtual Machines with the support of JDWP.
- Now, launch our target application and run the same command to see the listening port associated with our target application. It looks as shown below.
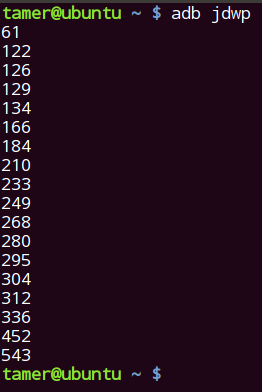
Figure 2
If we observe the difference between Figure 2 and Figure 3, there is one extra port 543 listening after launching the target application in Figure 3. We will attach JDB to the application using this port, since this is our target.
- Before attaching to the application, we need to port forward using adb since we are using remote debugging. This is shown in Figure 4.

Figure 4
- Now, let's attach JDB to the application as shown in the following figure.

Figure 5
Runtime code injection
In this step, we will actually exploit the vulnerable application by modifying its behavior at runtime.
To modify the application's behavior at runtime, we need to set up breakpoints and control the flow. But, we don't know what classes and methods are used in the application. So, let's use the following commands to find out the classes and methods used in the application.
To find the classes: "classes"
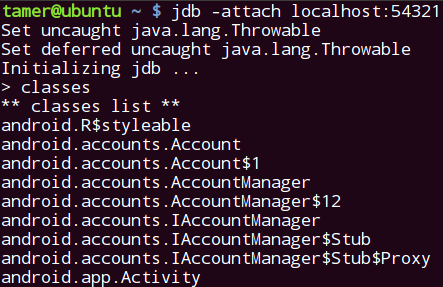
Figure 6.1
Since I have too many classes listed, I am listing only a few classes. But if you still scroll down, you will see some interesting user defined classes as shown in the figure below.

Figure 6.2
Now, let us see the methods associated with MainActivity$1 class using the following command.
"methods com.example.debug.MainActivity$1"
This is shown in figure 7.
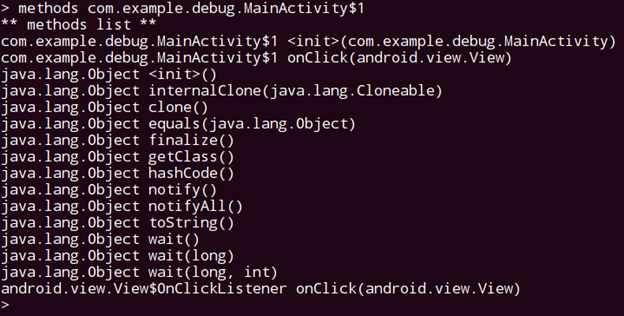
Figure 7
Now, let's set up a breakpoint at onClick method and control the execution of the app as shown in Figure 8.
"stop in com.example.debug.MainActivity$1.onClick(android.view.View)"

Figure 8
To hit the breakpoint, we will have to manually click the button in the application. Once after clicking the button, the breakpoint will be hit and it appears as shown in Figure 9.

Figure 9
From here onwards, we will be able to control and see the sensitive values, method arguments, etc. using various commands.
Just to understand what's happening in the background, I am following the code associated with the onClick method, which is shown in Figure 10.

Figure 10
Before proceeding further, let's see if there are any local variables at this point in time using the command "locals".

Figure 11
As we can see, there is no interesting information for us.
So, let's execute the next line using the "next" command as shown below.

Figure 12
Let's again try executing the command "locals" to see what happened in the previous command.

Figure 13
It's pretty clear that TextView has been loaded into method arguments. If we look at the source code provided in Figure 10, the line associated with TextView instantiation has been executed.
Let's now execute the next lines by executing the "next" command, and check the local variables as shown in the figure below.

Figure 14
As we can see, all the local variables have been displayed. The string "secret" looks interesting. The value "Try Again" is what is going to be printed when we click the button.
From Figure 10, it is very clear that the method setText is getting executed to print the value "Try Again". So, let's use the "step" command to get into the definition of the "setText" method and dynamically modify the text to be printed.

Figure 15
Let's see the local variables inside the definition using "locals".
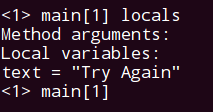
Figure 16
Now, let's change the value of "text" from "Try Again" to "Hacked" using "set" command.

Figure 17
We cannot see any changes in the application, since we haven't executed the modified code.
So, let's run the application using the "run" command as shown below, and see the application's output on its screen.

Figure 18
Let's look at the application running in the emulator.

Figure 19
We have successfully modified the output of the application at runtime. This is just an example to show how an application's behavior can be modified if the application is debuggable. We can perform various other things including "Getting a shell" on the device in the context of the vulnerable application.

11 courses, 8+ hours of training
Conclusion
In this article, we have demonstrated how one can exploit an Android application if it is left debuggable when moving it to the production. Pentesters should always look for this vulnerability during their Android app pentests.


