Analyzing the mod security logs
In the previous article, we had already configured the Mod-Security Firewall with OWASP Core Rule Set (CRS). But installing and configuring the Mod Security alone is not enough, as we are using the standard OWASP Core Rule set. The common problem with standard OWASP (CRS) is that it gives so many false positive results. So, we need to customize the OWASP rules according to the application logic. But, before the customization of the rules, we need to understand the different types of logs which are generated by the Mod Security. In this article we will analyze the different types of Mod Security logs. Generally, these logs are categorized into the following types.
- Error Logs
- Debug Logs
- Audit Logs
Learn Python for Pentesting
Error logs
These are the type of logs which are generated when an error or any malicious attempt is encountered on the server. As Mod Security works with Apache, all error logs (Apache error logs + Mod Security Error Logs) are generated in the same file. It means all Apache error logs, warnings, fatal errors etc, and the Mod Security error logs are found in the same file, which is by default located in the following path.
/var/logs/httpd/error_logs
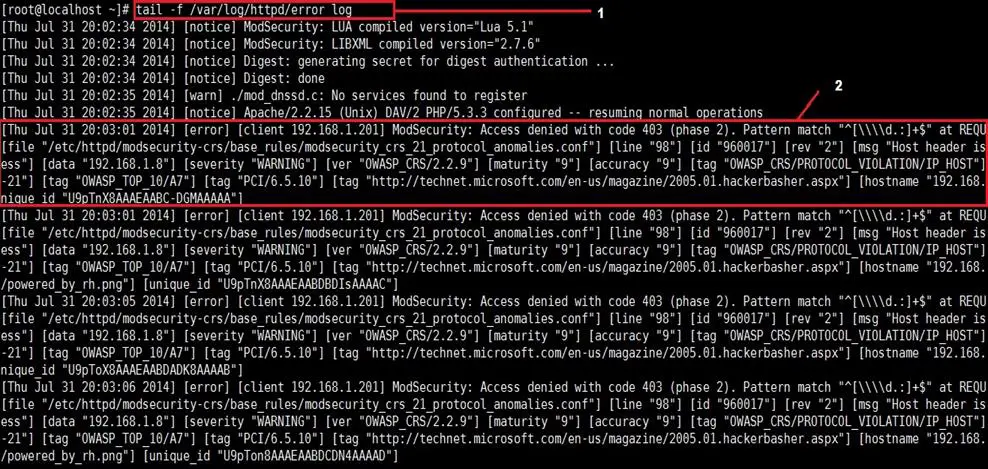
Each marked section has its own meaning, which is described below.
- tail –f is a command line utility for viewing or monitoring the live logs.
- It is an error log which was generated by Mod Security firewall.
Debug logs
Debug logs look like the same as the error logs, but these logs are used for debugging purposes. We can say that it is going to be our primary troubleshooting tool. We can enable the debug logs by adding some line of code in whitelist.conf file.
Enable debug log steps:
- Open whitelist.conf file through the following command.
- vim /etc/httpd/modsecurity.d/whitelist.conf

- Add the following code in the end of the file and save it. Then, restart the Apache service.
- # Debug log
- SecDebugLog /var/log/httpd/debug.log
- SecDebugLogLevel 3
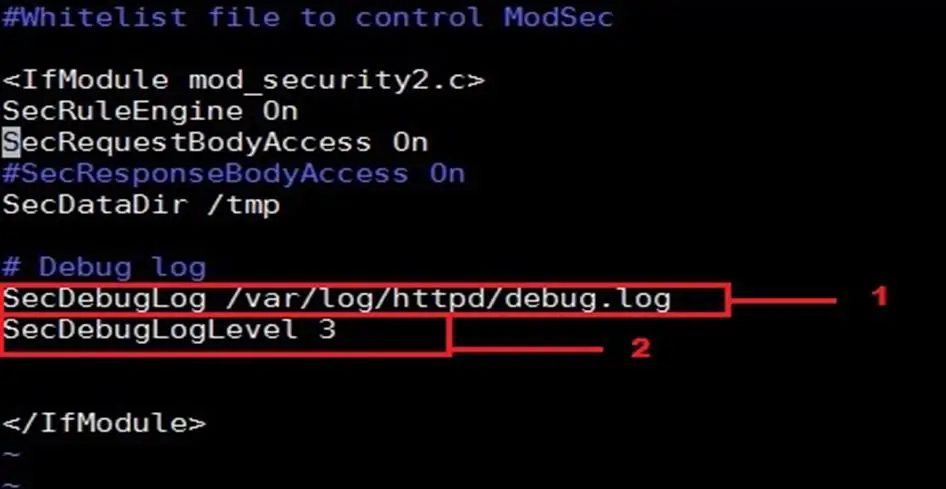
Each marked line has its own meaning, which is described in the below section.
1. SecDebugLog: This is the Debug log path and file name in which the debug will be generated. This file and path can be changed as per the requirements. As of now we are using /var/www/httpd directory and debug.log file will store all the debug logs.
2. In the production environment, we want to minimize the audit logs, as too much logging will affect the performance. The recommended debug log level for production is 3, which will duplicate logs which you will also see in apache's error log. The possible values for the debug log level are:
- 0: No logging
- 1: errors
- 2: warnings
- 3: notices
- 4: details of how transactions are handled
- 5: as above, but including information about each piece of information handled
- 6: log everything
As of now, we are using Debug Log Level 3. Other options may be used according to the need.
Audit logs
These are detailed information about the log which has been generated by the Mod Security. In simple words, we can say when Mod Security detects that a malicious event has occurred and has been inserted into error logs, it will generate an audit log entry in an audit log file according to the configuration. It is the most useful piece of information the system will collect, as it has the actual client request including the client header and data payload about the attack or event. These logs are not configured by default. We have to enable these logs by adding the following commands in the whitelist.conf file.
Steps for enabling audit logs in Mod-Security
- Open whitelist.conf file in vi editor.
- Vim /etc/httpd/modsecurity.d/whitelist.conf
- After that, copy and paste the following code in the file and save it.
- # Serial audit log
- SecAuditEngine RelevantOnly
- SecAuditLogRelevantStatus ^2-5
- SecAuditLogParts ABCIFHZ
- SecAuditLogType Serial
- SecAuditLog /var/log/httpd/modsec_audit.log
- </IfModule>
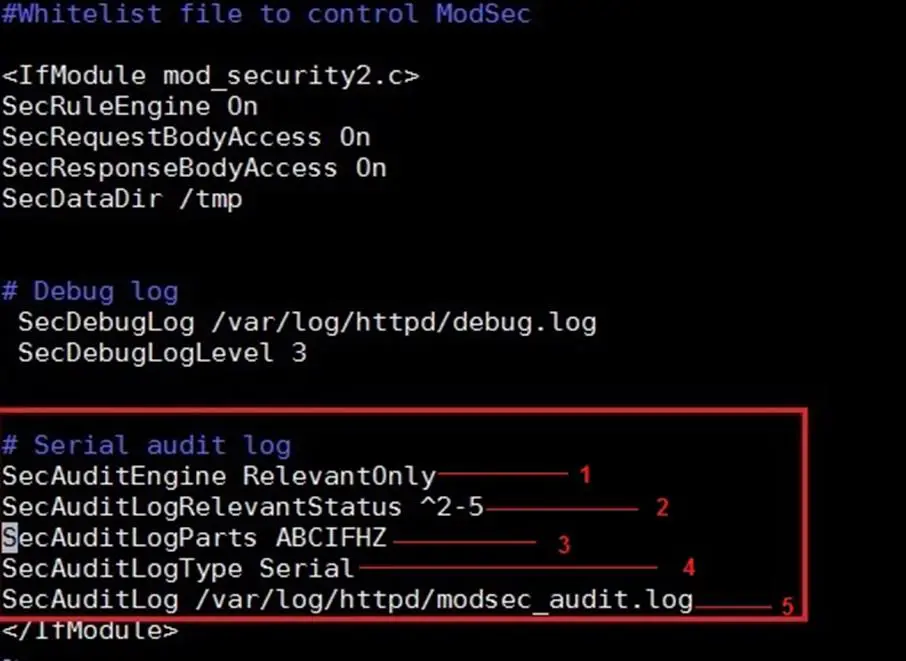
In the above screenshot, each marked line is explained below.
1. SecAuditEngine: This directive is used to configure the audit log engine which logs the complete transactions. Mod Security is currently able to log most, but not all the transactions. It has three options. On, Off and ReleventOnly.
- On: Log all transactions.
- Off: Don't log any transactions.
- RelevantOnly: Only log transactions that have triggered a warning or errors or have a status code that is considered to be relevant.
As of now, we have set this option to RelevantOnly. Other options may be used according to the need.
2. SecAuditLogRelevantStatus: It specifies which response status code is to be considered relevant for the purpose of audit logging. As of now we have defined 2-5. It means Mod Security will recode all the log entries which are not relevant.
3. SecAuditLogParts: Audit log is quite large as it logs everything about the request, like Request Header, Response Header, Request Body and Body Response, etc. So, through this option we can actually tell the Mod Security what should be logged in the error logs and what should be ignored. In order to do this, each part is assigned an alphabet. Here is the table in which every alphabet's meaning is defined.
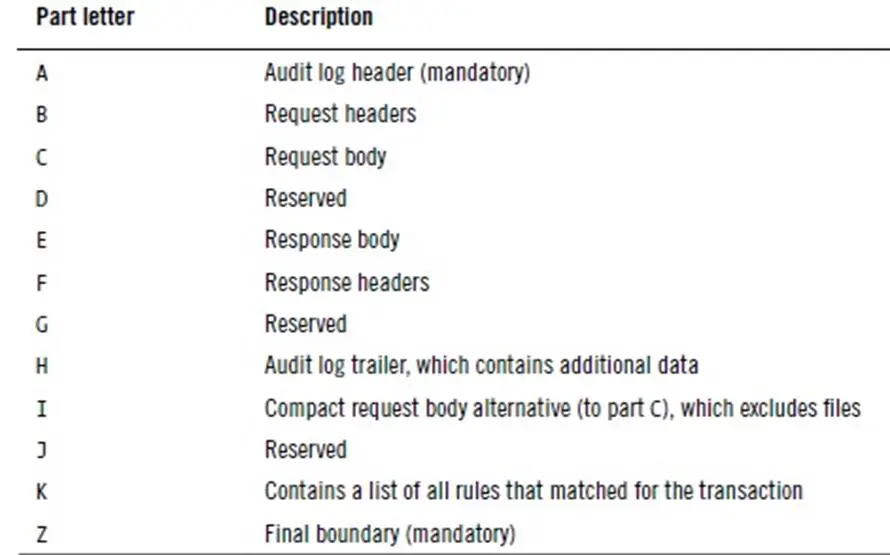
Here, we are using ABCIFHZ options.
4. SecAuditLogType: We can store the audit logs in two types. The first one is SERIAL, in which the entire log will be stored in a single file, specified by the SecAuditLog. This approach is convenient for casual use, but it can slow down the server as only one audit log entry can be written to the file at a time.
The second approach we can use is CONCURRENT, in which one file per transaction is used for logging. This approach is more scalable when heavy logging is required, as multiple transactions can be recorded in parallel.
For now, we are using the SERIAL approach for logging.
5. SecAuditLog: This directive is used to give the Audit log a path in which all audit log files will be stored.
As of now, we are using /var/log/httpd directory and modsec_audit.log file for recording the audit logs.
Analyzing the Mod Security error logs:
Let's analyze the logs. We can open this file in any text editor, like Vim editor, as it is available by default in every Linux machine or we can use another Linux command line utility tail command with –f switch.
Syntax:
tail –f <filename>
This command will give you real time output of the logs.
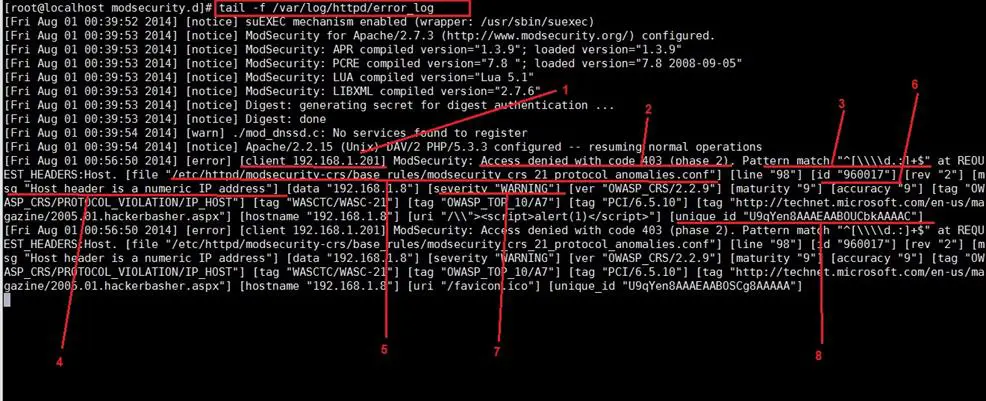
In the above screenshot, each marked section is explained below.
1. The first thing we get from the error log is Client IP Address in which the request was generated. In the above image the client IP address is 192.168.1.201
2. In this section, Mod Security generates the message according to the configuration. When any request gets blocked by Mod Security, by default it gets configured to redirect 403 page with the message of "Access Denied". We can also customize this page or redirect the user on some other pages also.
3. The next and important information in the error log is Pattern. On the basis of pattern, Mod Security blocks the request. The pattern has been defined in the Core Rule Set (CRS). It also tells us where and what patterns were matched and when the request was blocked.
4. This gives brief information about the Mod Security error, like why Mod Security blocked the request. As we can see in the above screen shot, the following message is given:
"Host header is a numeric IP address"
Basically, it is not a vulnerability, but Mod Security couldn't allow a website which is running over the IP address as we are using a website on a local host – that's why Mod Security blocked the request. In the later section, we will also see how we can whitelist these rules.
5. In this section, Mod Security configuration file path is given in which Mod Security defines the rule for that. In the above image, the file path is following:
/etc/httpd/modsecurity-crs/base_rules/modsecurity_crs_21_protocol_anomalies.conf
This is the file in which the rules are defined by Mod Security.
6. Every rule which is defined in the Core Rule Set (CRS) is identified by the ID. This is the ID of the rule. The ID is very important when we play with rules.
7. This is the severity of the error. It is categorized according to the OWASP to 10 or the WASC international standard.
8. The final and most important information which is found in the error is the unique ID. Mod Security audit logs are generated according to the unique ID. If we want to know about the details like what was the request, when the error was generated, or what was the payload, we need this unique id.
Analysis of Mod Security audit logs
In the above section, we have seen the Unique ID of every error log. Now, we will analyse the audit log for the same. First of all, we have to find the unique ID of the error log. For that, open the error log file and note down the unique ID.

In the above screen shot, we can see the unique ID of the error log is "U9sTnX8AAAEAABoWC68AAAAC".
Now, open the modsec_audit.log file and search this ID. After that, the following details will appear on the screen. For searching, we can use any command line utility which is by default available in the Linux operating system, like we can use the grep command or we can simply open this file in VI editor and search for the ID putting the "?" sign before the ID.
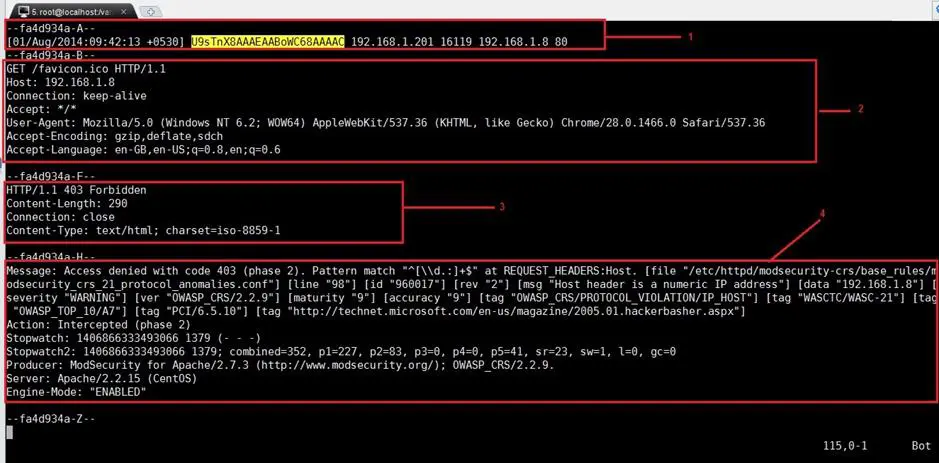
The meaning of each section is described below.
1. In this section we can see the Date and Time of the log, unique ID (which was identified through the error log) and the source and destination IP address with the Port No.
2. It is the request we get from the client. It plays a very important role in the analysis of the root cause of the attacks. In our scenario, we can see the user is hitting the server through the IP address that can be seen in the Host field.
3. It is the response of the server which was sent by the server. The OWASP Mod Security rule won't allow host to be an IP address, that's why the server has send the 403 Forbidden error to the user.
4. It simply gives a copy of the error log.
Learn Network Forensics
Sources
- ModSecurity Hand Book
- ModSecurity, Sourceforge
- ModSecurity, GitHub
- Log analysis, Wikipedia
- Atomic ModSecurity Rules, Atomicorp


