Introduction to debugging Android apps using AndBug
Introduction:
In the previous article of this series, we discussed how to write Cydia substrate extensions to hook into Android Applications. In this article, let us discuss how to analyze Android apps using AndBug. According to its documentation, "AndBug is a reverse-engineering debugger for the Android Dalvik virtual machine employing the Java Debug Wire Protocol (JDWP) to interact with Android applications without the need for source code." Along with its various features,
AndBug can be used to understand what's happening when a specific class/method is loaded when the app is running. The best part of this tool is, it is super simple to use.
Setup
AndBug can be downloaded from the following link.
Learn Secure Coding
https://github.com/swdunlop/AndBug
Once after downloading, use the following commands to unzip and install AndBug on your machine. Make sure that you have python installed before doing this.
$
$cd AndBug-master
$
$ ls
CONTRIBUTORS Makefile andbug info pylint.rc tests
LICENSE README.rst build lib setup.py
$
$ sudo python setup.py install
$
After finishing the installation, you can run AndBug as shown in the excerpt below to check if the installation is successful.
## AndBug (C) 2011 Scott W. Dunlop <swdunlop@gmail.com>
AndBug is a reverse-engineering debugger for the Android Dalvik virtual machine employing the Java Debug Wire Protocol (JDWP) to interact with Android applications without the need for source code. The majority of AndBug's commands require the context of a connected Android device and a specific Android process to target, which should be specified using the -d and -p options.
The debugger offers two modes -- interactive and noninteractive, and a comprehensive Python API for writing debugging scripts. The interactive mode is
accessed using:
$ andbug shell [-d <device>] -p <process>.
The device specification, if omitted, defaults in an identical fashion to the ADB debugging bridge command, which AndBug uses heavily. The process
specification is either the PID of the process to debug, or the name of the process, as found in "adb shell ps."
AndBug is NOT intended for a piracy tool or other illegal purposes, but as a tool for researchers and developers to gain insight into the implementation
of Android applications. Use of AndBug is at your own risk, like most open source tools, and no guarantee of fitness or safety is made or implied.
## Options:
-- -p, --pid <opt>
the process to be debugged, by pid or name
-- -d, --dev <opt>
the device or emulator to be debugged (see adb)
-- -s, --src <opt>
adds a directory where .java or .smali files could be found
## Commands:
-- class-trace | ct | ctrace <class-path>
reports calls to dalvik methods associated with a class
-- classes [<partial class name>]
lists loaded classes. if no partial class name supplied, list all classes.
-- dump <class-path> [<method-query>]
dumps methods using original sources or apktool sources
-- help [<command>]
information about how to use andbug
-- inspect <object-id>
inspect an object
-- methods <class-path> [<method-query>]
lists the methods of a class
-- shell
starts the andbug shell with the specified process
-- source <src-dir>
adds a source directory for finding files
-- statics <class-path>
lists the methods of a class
-- thread-trace | tt | ttrace <thread-name>
reports calls to specific thread in the process
-- threads [<name>] [verbose=<verbose level>]
lists threads in the process. verbosity: 0 (thread), (1 methods), (2 vars), (3 vars data)
-- version | v
Send version request.
## Examples:
-- andbug classes -p com.ioactive.decoy
-- andbug methods -p com.ioactive.decoy com.ioactive.decoy.DecoyActivity onInit
Now, start an emulator and verify if it is accessible via adb as shown below.
List of devices attached
emulator-5554 device
$
As you can see in the above excerpt, an emulator is running. Now, we need an app to test and observe the results. I have developed a simple application for this article. The target app can be downloaded from the downloads section of this article. The app uses a publicly available wrapper called AESCrypt to encrypt the card numbers entered by the user. Please note that the passphrase used to generate the key is hard coded within the application.
You can install the application using the following command.
Analyzing the target app:
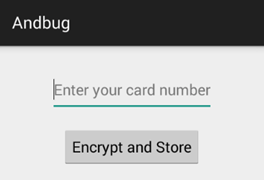
Now that, we have completed the setup. Let's launch the target application for analysis using AndBug. When the application is launched, it looks as shown below.

Next, let us find out the process id of this target application using adb. We can do it by running ps command and grep the string andbug.
u0_a69 1090 57 199052 23260 ffffffff b6ec35cc S com.androidpentesting.andbug
The above command shows that the process id of andbug in my case is 1090.
Let's hook into this process using AndBug and get a shell to interact. This can be done as shown below.
$ andbug shell -p 1090
## AndBug (C) 2011 Scott W. Dunlop <swdunlop@gmail.com>
We can do various interesting things using the shell we have now. Let's first identify the loaded classes. This can be done as shown below.
## Loaded Classes
-- com.androidpentesting.andbug.MainActivity
-- com.androidpentesting.andbug.MainActivity$1
>>
As you can notice, we are looking for the classes using the word andbug. There are two classes loaded matching this search query. You can also search using the complete package name.
Now, lets identify the methods loaded in
com.androidpentesting.andbug.MainActivity class. This can be done as shown below.
## Methods Lcom/androidpentesting/andbug/MainActivity;
-- com.androidpentesting.andbug.MainActivity.<init>()V
-- com.androidpentesting.andbug.MainActivity.access$000(Lcom/androidpentesting/andbug/MainActivity;Ljava/lang/String;Ljava/lang/String;)V
-- com.androidpentesting.andbug.MainActivity.encryptandSave(Ljava/lang/String;Ljava/lang/String;)V
-- com.androidpentesting.andbug.MainActivity.onCreate(Landroid/os/Bundle;)V
>>
As you can see in the above excerpt, encryptandSave() is one interesting method within the class.
Here is where the interesting part comes in. We can hook into these methods using method-trace command and monitor them while the application is running. If you want to analyze all the methods within a class, you can simply run ct command, which is short for class-trace.
Lets run ct command against com.androidpentesting.andbug.MainActivity class. This is shown below.
## Setting Hooks
-- Hooked com.androidpentesting.andbug.MainActivity
>>
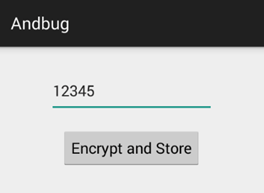
As you can see in the above excerpt, the specified class has been hooked. Now, lets come back to the application and enter a number and then click Encrypt and Store button.

When the button is clicked, the application takes the user input, encrypts the input using AES 256 and then stores the encrypted string in SharedPreferences. This is shown below.
root@generic:/ # cd data/data/com.androidpentesting.andbug
root@generic:/data/data/com.androidpentesting.andbug # ls
cache
lib
shared_prefs
root@generic:/data/data/com.androidpentesting.andbug # cd shared_prefs
root@generic:/data/data/com.androidpentesting.andbug/shared_prefs # ls
bankdetails.xml
ankdetails.xml <
<?xml version='1.0' encoding='utf-8' standalone='yes' ?>
<map>
<string name="accountnumber">789W4Kw6WOtAmY6fKasj3g==</string>
</map>
root@generic:/data/data/com.androidpentesting.andbug/shared_prefs #
As you can see in the above excerpt, the string is encrypted and stored.
But, let's come back and see what happened at AndBug shell.
## Setting Hooks
-- Hooked com.androidpentesting.andbug.MainActivity
>> ## trace thread <1> main (running suspended)
-- com.androidpentesting.andbug.MainActivity.access$000
(Lcom/androidpentesting/andbug/MainActivity;Ljava/lang/String;Ljava/lang/String;)V:0
-- com.androidpentesting.andbug.MainActivity$1.onClick(Landroid/view/View;)V:25
-- this=Lcom/androidpentesting/andbug/MainActivity$1; <831945677304>
-- accountnumber=12345
-- v=Landroid/widget/Button; <831945630640>
-- android.view.View.performClick()Z:18
-- this=Landroid/widget/Button; <831945630640>
-- li=Landroid/view/View$ListenerInfo; <831945677320>
-- android.view.View$PerformClick.run()V:2
-- this=Landroid/view/View$PerformClick; <831945498576>
com.androidpentesting.andbug.MainActivity.access$000
(Lcom/androidpentesting/andbug/MainActivity;Ljava/lang/String;Ljava/lang/String;)V:6
-- x2=superstrongsecretkey
-- x0=Lcom/androidpentesting/andbug/MainActivity; <831945423976>
-- x1=12345
-- com.androidpentesting.andbug.MainActivity$1.onClick(Landroid/view/View;)V:25
-- this=Lcom/androidpentesting/andbug/MainActivity$1; <831945677304>
-- accountnumber=12345
-- v=Landroid/widget/Button; <831945630640>
-- android.view.View.performClick()Z:18
-- this=Landroid/widget/Button; <831945630640>
-- li=Landroid/view/View$ListenerInfo; <831945677320>
Interesting! We could see the passphrase used to generate the encryption key. When a specific method is invoked, AndBug shows its arguments as shown in the above excerpt. This comes handy in a variety of scenarios during our penetration tests. In the above case, the output is truncated, but AndBug shows all the methods and their arguments of the specified class. As mentioned earlier, you can use method-trace or mt command to hook into a specific method.
Learn Secure Coding
AndBug is an interesting and useful tool that should be in your arsenal during black box assessments of Android Applications. I am sure; you will also start loving this tool if you use it once.


