Anti-debugging: Detecting system debugger
In the previous tutorial, we've talked about techniques that harden the reverse engineering of the executable and then we looked at anti-debugging techniques. We've mentioned the IsDebuggerPresent function and analyzed it in depth. Now in this tutorial, we're going to look at other ways we can use anti-debugging techniques to detect whether a debugger is being used to debug the program in question.
SystemKernelDebuggerInformation
The SystemKernelDebuggerInformation function can be used to determine if a kernel debugger is currently being attached to the system. We can retrieve specified system information with functions like NtQuerySystemInformation or ZwQuerySystemInformation.
Let's take a look at the NtQuerySystemInformation function first; the syntax of which is as follows:
[plain]
NTSTATUS WINAPI NtQuerySystemInformation(
_In_ SYSTEM_INFORMATION_CLASS SystemInformationClass,
_Inout_ PVOID SystemInformation,
_In_ ULONG SystemInformationLength,
_Out_opt_ PULONG ReturnLength
);
[/plain]
We need to pass four parameters to the function:
- SystemInformationClass: the type of the system information that we would like to retrieve. Possible values are: SystemBasicInformation, SystemExceptionInformation, etc [1].
- SystemInformation: a pointer to a buffer that receives the requested information [1].
- SystemInformationLength: the size of the buffer pointed to by the SystemInformation parameter.
- ReturnLength: an optional pointer to a location where the function writes the actual size of the information requested.
The ZwQuerySystemInformation function is basically the same as NtQuerySystemInformation, so we won't describe it in detail. Let's just present its syntax, which can be seen below:
[plain]
NTSTATUS WINAPI ZwQuerySystemInformation(
_In_ SYSTEM_INFORMATION_CLASS SystemInformationClass,
_Inout_ PVOID SystemInformation,
_In_ ULONG SystemInformationLength,
_Out_opt_ PULONG ReturnLength
);
[/plain]
It's a common belief that we should use Zw functions when doing really low level stuff, so we'll use that function in our example. At the end of the MSDN function call API reference, there's an important sentence that says the following: "If you do use ZwQuerySystemInformation, access the function through run-time dynamic linking. This gives your code an opportunity to respond gracefully if the function has been changed or removed from the operating system. Signature changes, however, may not be detectable. This function has no associated import library. You must use the LoadLibrary and GetProcAddress functions to dynamically link to Ntdll.dll."
This means that we can't just include the Ntdll library into our program and call the function directly. Instead, we must dynamically load the Ntdll.dll library into the process and get the address of the function before calling it.
At first, we can write a program like this to confirm that the function we would like to call is indeed accessible in the Ntdll.dll library:
[cpp]
#include "stdafx.h"
#include <stdio.h>
#include <windows.h>
#include <Winternl.h>
int _tmain(int argc, _TCHAR* argv[]) {
typedef long NTSTATUS;
#define STATUS_SUCCESS ((NTSTATUS)0L)
HANDLE hProcess = GetCurrentProcess();
typedef struct _SYSTEM_KERNEL_DEBUGGER_INFORMATION {
BOOLEAN DebuggerEnabled;
BOOLEAN DebuggerNotPresent;
} SYSTEM_KERNEL_DEBUGGER_INFORMATION, *PSYSTEM_KERNEL_DEBUGGER_INFORMATION;
enum SYSTEM_INFORMATION_CLASS { SystemKernelDebuggerInformation = 35 };
typedef NTSTATUS (__stdcall *ZW_QUERY_SYSTEM_INFORMATION)(IN SYSTEM_INFORMATION_CLASS SystemInformationClass, IN OUT PVOID SystemInformation, IN ULONG SystemInformationLength, OUT PULONG ReturnLength);
ZW_QUERY_SYSTEM_INFORMATION ZwQuerySystemInformation;
SYSTEM_KERNEL_DEBUGGER_INFORMATION Info;
/* load the ntdll.dll */
HMODULE hModule = LoadLibrary(_T("ntdll.dll"));
ZwQuerySystemInformation = (ZW_QUERY_SYSTEM_INFORMATION)GetProcAddress(hModule, "ZwQuerySystemInformation");
if(ZwQuerySystemInformation == NULL) {
printf("Error: could not find the function ZwQuerySystemInformation in library ntdll.dll.");
exit(-1);
}
printf("ZwQuerySystemInformation is located at 0x%08x in ntdll.dll.n", (unsigned int)ZwQuerySystemInformation);
if (STATUS_SUCCESS == ZwQuerySystemInformation(SystemKernelDebuggerInformation, &Info, sizeof(Info), NULL)) {
if (Info.DebuggerEnabled && !Info.DebuggerNotPresent) {
printf("System debugger is present.");
}
else {
printf("System debugger is not present.");
}
}
/* wait */
getchar();
return 0;
}
[/cpp]
We can see that we've called the LoadLibrary function to load the Ntdll.dll library into the current program's address space. After that, we take the handle of the currently loaded module Ntdll.dll and use it within the GetProcAddress function call to get the address of the ZwQuerySystemInformation function. We then check whether the returned address is NULL, in which case the function is not present in the Ntdll.dll library so we print an error message about the absence of the function and terminate the program. Otherwise, the function is present in the Ntdll.dll library, so we print its address.
When we compile the program, the address of the function will be displayed. After that, we call the ZwQuerySystemInformation function to get the SystemKernelDebuggerInformation information that we need. We save the result in Info variable, which we then use to check if Info.DebuggerEnabled is true and if Info.DebuggerNotPresent is false. If both conditions hold, then we print that the system debugger is present, otherwise we print that the system debugger is not present.
Because we don't have a system debugger attached, the message saying system debugger not being present is displayed, as we can see on the picture below:

Trap flag
Here we'll exploit the fact that every debugger uses the TP in EFLAGS register when debugging the process. This can be used by setting the trap flag manually in the current process and checking if the exception is raised or not by the use of try-catch statements. If the except{} block is not called, then a debugger handled the exception and it is currently debugging the process. But if the except{} block was called, then a debugger isn't present and the process is executing normally without being debugged. This approach detects user-mode as well as kernel-mode debuggers, because they all use the trap flag for debugging a program.
The following code is taken from [2] and is the implementation of the above description:
[cpp]
#include "stdafx.h"
#include <stdio.h>
#include <windows.h>
int _tmain(int argc, _TCHAR* argv[]) {
BOOL bExceptionHit = FALSE;
__try {
_asm
{
pushfd
or dword ptr [esp], 0x100
popfd
// Set the Trap Flag
// Load value into EFLAGS register
nop
}
}
__except(EXCEPTION_EXECUTE_HANDLER) {
bExceptionHit = TRUE;
// An exception has been raised –
// there is no debugger.
}
if (bExceptionHit == FALSE)
printf("A debugger is present.n");
else
printf("There is no debugger present.n");
/* wait */
getchar();
return 0;
}
[/cpp]
We can see that first, we initialize the Boolean variable bExceptionHit to false. Then we use the try-except block to execute some code. In the try block is some code that must be executed where if an exception occurs, the except{} block is called which sets the Boolean bExceptionHit variable to true.
If we compile and run the program now under the Visual Studio debugger, the program will print a statement about the debugger being present, as we can see on the picture below:

This is ok and proves that the above code works as expected, since it was clearly able to identify that a debugger is present. But if we copy the compiled executable to Desktop and run that executable in cmd.exe, we can see that the program will print the statement about the debugger not being present; we can see this on the picture below:

This is proof that the above code works the way it should: it prints that the debugger is present when we're running the program under the debugger and it prints that the debugger is not present when running the program normally.
Let's take a look at the try{} block: in it, we're first saving the value of the flag register onto the stack. Then we're xoring the value pushed on the stack with the number 0x100 and restoring the flag register's value (the xored value). What follows is also one nop instruction that doesn't do anything. So far it's not exactly evident how the exception should occur because we're not doing anything that could result in an invalid exception being executed, but wait a few moments and everything will become clear.
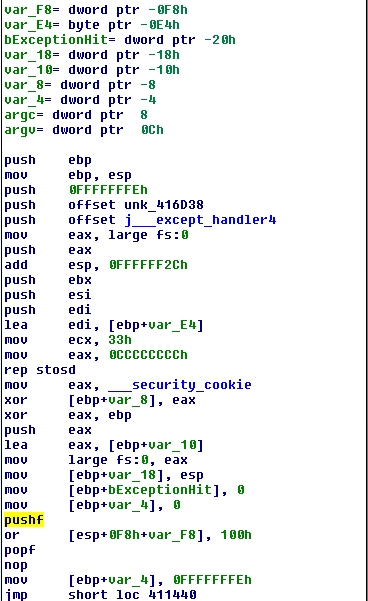
If we load the program in Ida debugger, we can quickly locate the main function of the executable, which is presented on the picture below:

In the main function, we first initialize the stack, but that's really not important at the moment. What's important is the assembly instruction from the C source code; we can see them on the picture above (notice the pushf instruction and the following 3 instructions). Those are exactly the instructions we've inputted in the C source code in the __asm block.
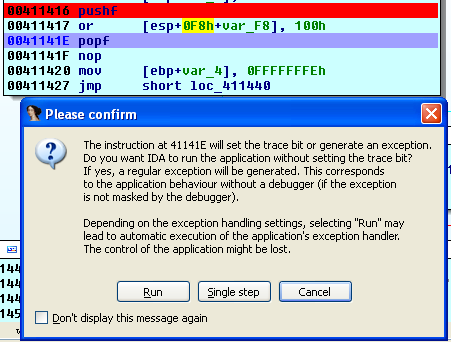
If we set a breakpoint on the pushf instruction and run the program, the program will stop executing exactly on the pushf instruction because of the breakpoint. If we then step through the program, an exception will occur when trying to execute the "popf" instruction. We can see the exception occurring on the picture below:

When we tried to execute the popf instruction, a new window pops up, notifying us that the instruction at address 0x41141E (which is exactly the popf instruction) is trying to set the trace bit in the flags register. Here we have a choice of either setting the trace bit, in which case we're telling Ida to handle the exception by itself, so the program's exception handler will not be invoked. If we press Run, we're telling Ida to ignore setting the trace bit and instead generate an exception, which will successfully invoke the program's exception handler routine and set the bExceptionHit to true.
Actually, we can only choose to press the buttons "Run" or "Single step" but in either case, the program's exception handling routine will be called, so the program will be able to determine that a debugger is being used to execute the program.
But why does the exception occur? When the pushf instruction is executed, it will push the values presented on the picture below to the stack:

So the value of 0x00000306 gets pushed to the stack at address 0x0012FE70. Then the xoring of the value 0x306 and 0x100 happens. Don't worry about the [esp+0F8h+var_F8], which is displayed by Ida; the local variable var_F8 holds the value -0xF8, so the expression is actually [esp+0F8h-0F8h], which points exactly to the top of the stack [esp].
So the following operation happens next:
0x306 == 0011 0000 0110
0x100 == 0001 0000 0000
------------ XOR -------------
0x206 == 0010 0000 0110
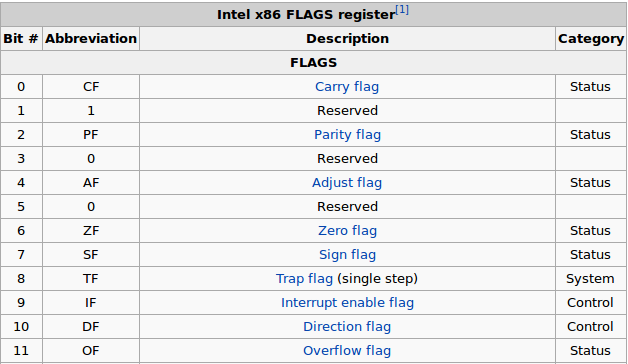
The end result of the XOR operation is 0x206, which is the new value of the FLAGS register. This effectively inverts the 9th (if we start counting at 1) bit of EFLAGS register, which corresponds to the trap flag TP. Let's also present the first 12 bits of the EFLAGS register, which can be seen below. Here we can clearly see that the 8th bit is the TF (if we start counting at 0). The picture is taken from the [3].

Basically, we're inverting the value of the trap flag register, which causes the exception to be generated. We can then catch the exception, which notifies us that the debugger is not present. But if we can't catch the exception, a debugger is clearly handling the exception and is not passing it on to the program to handle it.
Conclusion
We've seen two special techniques that can be used to detect whether a debugger is currently being used to run the executable or not. This can be a good way to detect if a user is debugging our application and to terminate the application if that happens, which effectively prevents users from debugging our application.
Sources
- Msdn Microsoft
- Eldad Eilam, Reversing, Secrets of Reverse Engineering.
- FLAGS register
- Chris Eagle, The IDA Pro Book: The unofficial guide to the world's most popular disassembler


